tfcb_2021
Lecture 2: Introduction to Data
Trevor Bedford (@trvrb, bedford.io)
Learning objectives
- Identify minimum requirements for a reproducible computational project
- Apply computational project organization principles specifically to good practices in data management
- Implement best practices for organizing tabular (spreadsheet-style) data according to tidy data principles
Class materials
This class requires Microsoft Excel (or an equivalent program that can open .xlsx files); see Software installation for more information.
Reminders
- Recommended reading is available throughout each section
- The homework assignment is available on October 7 and is due October 14 at 1pm.
Reproducible science
Motivation
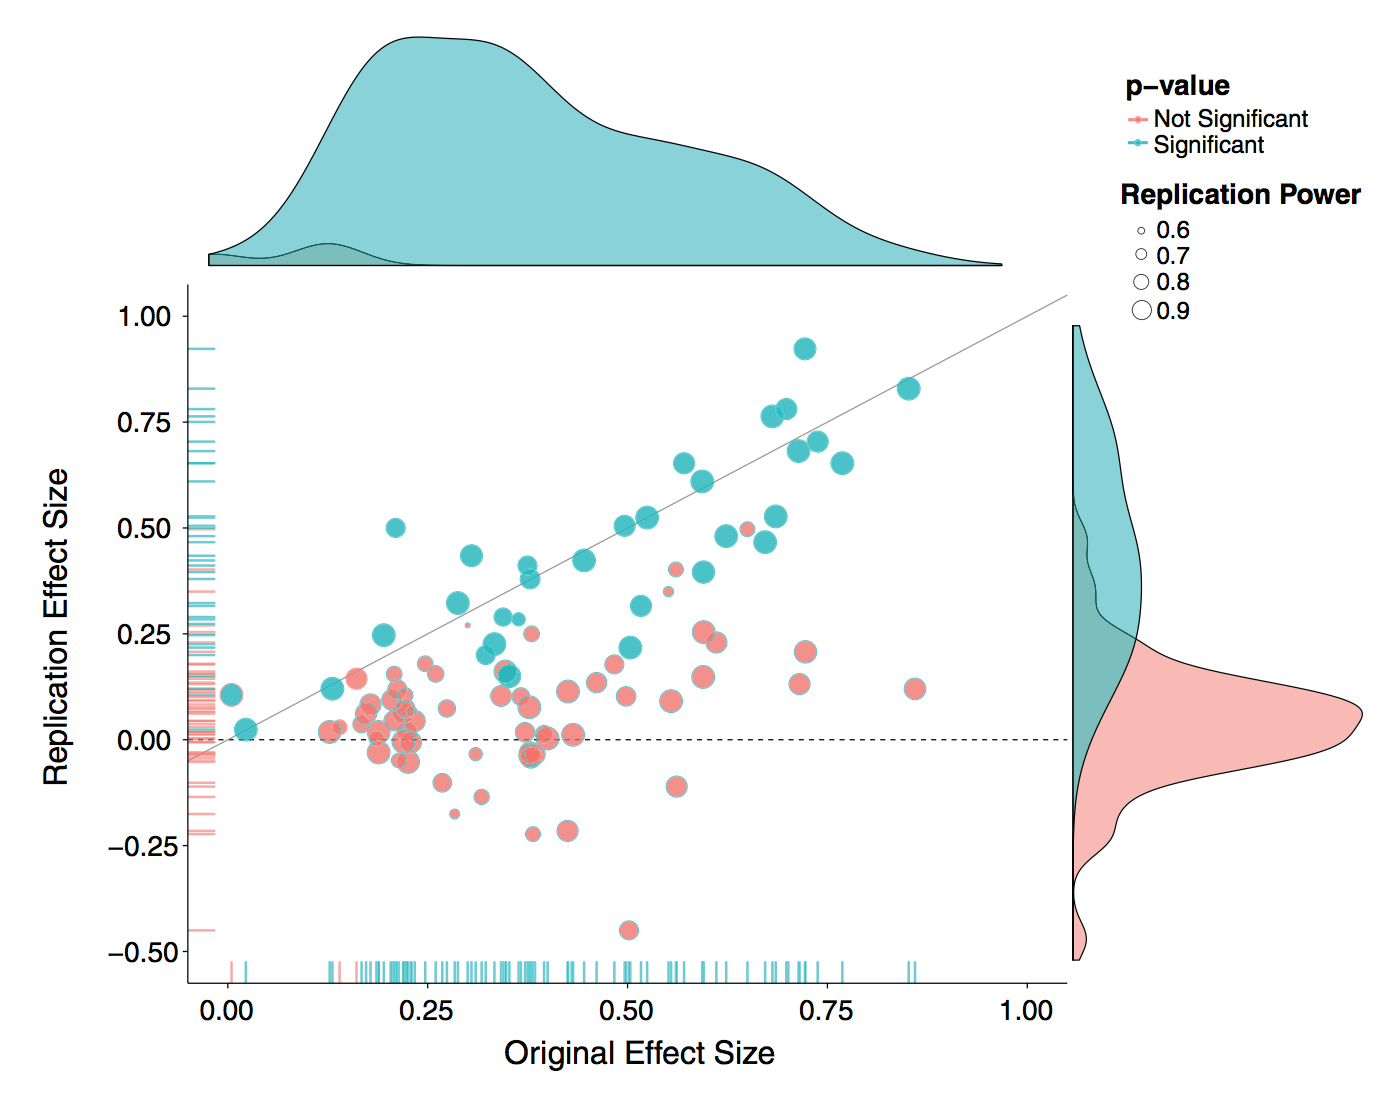
There is a lot of interest and discussion of the reproducibility “crisis”. In one example, “Estimating the reproducibility of psychological science” (Open Science Collaboration, Science 2015), authors attempt to replicate 100 studies in psychology and find that only 36 of the studies had statistically significant results.
The Center for Open Science has also embarked on a Reproducibility Project for Cancer Biology, with results being reported in an ongoing fashion.
There are a lot of factors at play here, including “p hacking” lead by the “garden of forking paths” and selective publication of significant results. I would call this a crisis of replication and have this as a separate concept from reproducibility.
But even reproducibility is also difficult to achieve. In “An empirical analysis of journal policy effectiveness for computational reproducibility” (Stodden et al, PNAS 2018), Stodden, Seiler and Ma:
Evaluate the effectiveness of journal policy that requires the data and code necessary for reproducibility be made available postpublication by the authors upon request. We assess the effectiveness of such a policy by (i) requesting data and code from authors and (ii) attempting replication of the published findings. We chose a random sample of 204 scientific papers published in the journal Science after the implementation of their policy in February 2011. We found that we were able to obtain artifacts from 44% of our sample and were able to reproduce the findings for 26%.
They get responses like:
“When you approach a PI for the source codes and raw data, you better explain who you are, whom you work for, why you need the data and what you are going to do with it.”
“I have to say that this is a very unusual request without any explanation! Please ask your supervisor to send me an email with a detailed, and I mean detailed, explanation.”
Tables in paper are interesting.
At the very least, it should be possible to take the raw data that forms the the basis of a paper and run the same analysis that the author used and confirm that it generates the same results. This is my bar for reproducibility.
Reproducible science guidelines
My number one suggestion for reproducible research is to have:
One paper = One GitHub repo
Put both data and code into this repository. This should be all someone needs to reproduce your results.
Digression to demo GitHub.
This has a few added benefits:
-
Versioning data and code through GitHub allows you to collaborate with colleagues on code. It’s extremely difficult to work on the same computational project otherwise. Even Dropbox is messy.
-
You’re always working with future you. Having a single clean repo with documented readme makes it possible to come back to a project years later and actually get something done.
-
Other people can build off your work and we make science a better place.
I have a couple examples to look at here:
- My 2015 paper on global migration of influenza viruses: github.com/blab/global-migration
- Sidney Bell’s 2018 paper on dengue evolutionary dynamics: github.com/blab/dengue-antigenic-dynamics
Some things to notice:
- There is a top-level
README.md(written in Markdown…) file that describes what the thing is, provides authors, provides a citation and link to the paper and gives an overview of project organization. - There is a top-level
data/directory. - Each directory should have a
README.mdfile describing its contents. - The readme files should specify commands to run, or point to the make file that does.
- Versioned Jupyter notebooks (example) are viewable in the browser, as are
.tsvfiles (example). - Relative links throughout.
- Include language-specific dependency install file, Python uses
requirements.txtas standard, or even better use Conda or Docker. - Figures are embedded directly in the readme files via Markdown (example).
If there is too much raw data to include in GitHub (100Mb max is allowed), my preferred strategy is to store raw data in Amazon S3 (or the equivalent) and fetch this data as part of processing scripts.
- Katie Kistler’s 2021 preprint on SARS-CoV-2 adaptive evolution: github.com/blab/sarscov2-adaptive-evolution computes SARS-CoV-2 trees using the supplied Nextstrain workflow and retrieves these trees from Amazon S3 when computing figures.
More sophisticated examples will use a workflow manager like Snakemake to automate builds. For example:
- Alistair Russell and Jesse Bloom’s recent work on single-cell sequencing of influenza: github.com/jbloomlab/IFNsorted_flu_single_cell/
- John Huddelston’s influenza forecasting work: github.com/blab/flu-forecasting (this also provides a Conda environment for better reproducibility)
With GitHub as lingua franca for reproducible research, there are now services built on top of this model. For example:
- Zenodo allows you to mint DOIs from GitHub releases.
- In github.com/trvrb/sismid, I provide a notebook for running evolutionary simulations. You can use Binder to launch an interactive Jupyter notebook without installing any code locally via: mybinder.org/v2/gh/trvrb/sismid/HEAD
- We’ve built Nextstrain to look for results files in public GitHub repos to provide interactive figures. For example community/blab/ncov-cryptic-transmission provides an interactive visualization directly from files hosted on GitHub at github.com/blab/ncov-cryptic-transmission/.
Project communication
For me, as PI, I enforce a further rule:
One paper = One GitHub repo = One Slack channel
It’s much easier if all project communication goes in one place.
Further reading
Some suggested readings on reproducible research include:
Project and data organization
It’s important to keep a tidy project directory, even if something is not as the stage of being versioned on GitHub.
Some general advice:
- Encapsulate everything within one directory, which is named after the project. Have a single directory for a project, containing all of the data, code, and results for that project. This makes it easier to find things, or to zip it all up and hand it off to someone else.
- Separate the data from the code. I prefer to put code and data in separate subdirectories. I’ll often have a
data/subdirectory and ascripts/(orsrc/) subdirectory. - Use relative paths (never absolute paths). If you encapsulate all data and code within a single project directory, then you can refer to data files with relative paths (e.g.,
../data/some_file.csv). If you were to use an absolute path (like~/Projects/SomeProject/data/some_file.csvorC:\Users\SomeOne\Projects\SomeProject\data\some_file.csv)then anyone who wanted to reproduce your results but had the project placed in some other location would have to go in and edit all of those directory/file names. - Write dates as YYYY-MM-DD. This sorts properly and also avoids ambiguities.
- Include readme files. This bit of documentation greatly helps in describing what a folder contains.
- Continually up-to-date directory. I aim for a clean and up-to-date directory that is continually modified rather than a chronological directory structure (as described in this article). A separate electronic lab notebook with chronological entries can be hugely helpful for record-keeping purposes.
File names
Borrowing excellent slide deck from Ciera Martinez and colleagues: Reproducible Science Workshop: File Naming
File organization
Continuing slide deck from Ciera Martinez and colleagues: Reproducible Science Workshop: Organization
Documenting your data
Ideally, your data/ directory will include an additional README that (at bare minimum) includes a data dictionary (e.g., what the rows and columns represent). Fully documented metadata (data about the data) will include:
- Data description: descriptions for labels of rows and columns (e.g., abbreviations defined, units of measurement)
- Intent: project description and purpose, reference to other published works and associated documentation (e.g., manuscripts)
- Collection method: experimental design
- File structure: if multiple data files are present, the organization and relationship among these files
- Data type: file types and formats
- Provenance: how data were created and by whom (including analytical pipelines), what normalization or transformations are currently represented
Documenting data can be a time-consuming process, but is often required to submit data to repositories. Since data publishing is a requirement for most academic research as a part of publication, keeping track of this information early on can save you time later, and increase the chances of other researchers using your data later (which means more citations for you).
Miscellaneous advice
More excellent advice from Karl Broman
Tidy data
Tidy data is term from Hadley Wickham and refers to:
A standard method of displaying a multivariate set of data is in the form of a data matrix in which rows correspond to sample individuals and columns to variables, so that the entry in the ith row and jth column gives the value of the jth variate as measured or observed on the ith individual.
Data in this form is much easier to deal with programmatically. This is also known as a data frame. This tutorial presents a nice overview.
Observations as rows and variables as columns is an excellent standard to adhere to.
- Each variable forms a column
- Each observation forms a row.
- Each type of observational unit forms a table
See for example, single cell RNA sequencing data, with cells as rows and genes as columns. This is also the way that relational databases (MySQL, Postgres, etc…) are constructed.
Exercise on tidy data
-
Demonstrate conversion of simple example dataset. Work from Table 2 in Bedford et al. 2014, available as an Excel table in the course repo.
-
Split into small groups of 3-4 people to work from an HI (haemagglutination-inhibition) table and convert to tidy data. Data available as an Excel table in the course repo.
File formats
Saving data as plain text files is necessarily to process this data with either R or Python. You can export from Excel to .tsv (tab-delimited, my preferred format) or .csv (comma-delimited). A few things to note when exporting data files in these formats:
- Beware that line endings differ between Windows and Unix (including Mac), though the text editors we recommend for this class can deal with this
- Exporting from Excel only works for the currently displayed spreadsheet. If you have multiple sheets, you’ll need to export multiple times.
Further reading
Some suggested readings include:
- Good Enough Practices for Scientific Computing by Wilson et al. as already referenced