Responsible visual analysis amid COVID-19
Written by: Lindsey Elhart - Data Analyst (2018-2020)
In wanting to understand this emerging disease better, I have dug into a myriad of coronavirus data sets over the past few weeks. This includes the daily refreshed reports from Johns Hopkins, mutations of the virus provided by NextStrain, testing data from Our World in Data (it is imperative to read their disclaimer on incomplete data), hospital inventory projections by IHME, and piecing together a timeline of countries’ actions.
I created an idea board of visuals and stories I hoped to tell with an overarching question of: how are populations affected with varying government responses? The approaches I studied ranged from deploying a rigorous screening program, to a laissez-faire approach, to regions acting independently, to the first country who activated its emergency response. As outbreaks start at different points in time, I created an even timeline by starting the analyses when each country hit 100 cases.
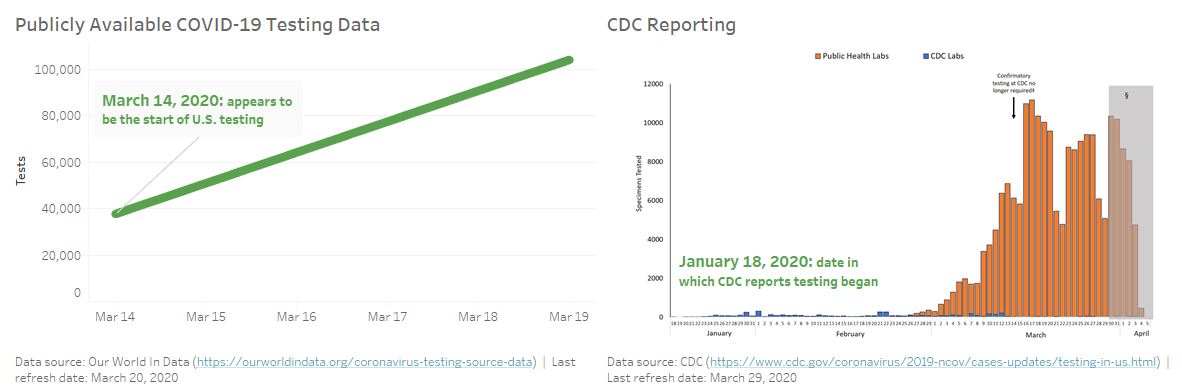
The more exploration I made, the more I realized there is more to this than I thought. For instance, calculations comparing tests to results were abnormal, recovery rates did not follow epidemiologists’ conclusions, and the timing in which tests were reported were skewed (see image below). Reasons for these unexpected results may be attributed to the fact that my calculations did not incorporate principles of epidemiology and there is no uniform method of reporting for a country, let alone a cross-country comparison. It was a difficult realization as I pride myself in learning complicated data sets, but this is a different environment - my expertise is not universal.
When comparing publicly available COVID-19 testing data (left) to CDC reporting (right), there is a nearly two-month difference in when testing was first reported in the United States. This comparison shows the tension in data exploration versus misconstruing a critical timeline. Individual analyses can be hampered by the constraint of public data and lack of expertise in public health.
Stakes are high in how visuals are interpreted by others, each data point means a livelihood, and my background is not in epidemiology. A responsible analysis does not just accumulate more data but explores and explains truth in deeper ways. Prompts to get started include: who is the intended audience, what is the motivation for this effort, how do you want the audience to act seeing your chart and how will you track it, what has been done in the past and what new value will this provide, and, perhaps most importantly, how can you know the numbers are right? I find there is such power in data, and this is a time where I get to be in awe and learn from the thoughtful modeling decisions made by public health experts.
A shout out to Amanda Makulec, author of this thought-provoking article, which helped me reflect on this and more.