Reading Guide for Interactive Pan-Genomes
Welcome to the Interactive Pan-Genome Library - a forum for publishing collections of microbial pan-genomes in an interactive, browsable format.
How are pan-genome displays constructed?
When comparing groups of microbial genomes, it can be useful to understand what groups of genes are encoded by different groups of organisms. While all individuals from a particular species contain a shared group of common genes, called the “core genome,” there is a much larger group of genes which are only found in a subset of strains, called the “accessory genome.” In some cases these “accessory” genes are present within a sub-species group, but in many other cases they may be distributed in a complex pattern driven by a history of horizontal gene transfer, gene loss, or large-scale recombination events. The purpose of the pan-genome displays shown in this library is to summarize which genes are found in which particular genomes from a particular species or group.
The displays shown in this library were generated with the gig-map software tool. This tool can be used to download a collection of genomes from sources like NCBI and identify which genomes contain each of the unique genes found in this group. The gig-map software is built using the powerful Nextflow workflow management system, with the DIAMOND aligner and Plotly for rendering the display. This website was built with Jekyll using the Mediumish theme.
How do I use them?
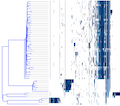
The layout of each pan-genome display follows a simple pattern:
- Each row is a genome
- Each column is a gene
- The color in each box of the grid indicates whether the gene is present in the genome
- The dendrogram (tree) on the left represents whole-genome similarity (based on average nucleotide identity)
The key feature of each pan-genome map is its interactivity. By clicking and dragging around groups of genes and/or genomes, you can “zoom in” to see more details. Because of the extremely large number of genes which can be present in a given pan-genome, the vast majority of gene names are not shown at the broadest level of resolution. By zooming in further you can see more of the individual genes which are present in a group of genomes. Moving the cursor around the display will also reveal the gene/genome name for each point in the map. Double-clicking the display will reset the zoom and show the full range of the map.

Useful Features
- Zoom in on a region of the map by clicking and dragging
- Dragging vertically will expand a subset of genomes
- Dragging horizontally will expand a subset of genes
- Moving the cursor over the display will show information about individual genes and genomes
- Save a snapshot by clicking the camera icon in the top-right corner
- Click the home icon to reset the display
- The control buttons at the top-right let you switch to a panning mode, in which clicking and dragging will move the zoomed region
- The dendrogram (tree) can be zoomed horizontally in an independent manner
Learning More
For a longer explanation of the scientific approach used to generate these interactive maps, please watch this video. All of the maps shown in the video are also available in the library.
Contact Us
To learn more about this project, please don’t hesitate to be in touch:
Sam Minot, Ph.D.
Email: first initial and last name at fredhutch dot org
Twitter: @sminot