Chapter 7 PAX7 target mis-regulation in FSHD biopsy RNA-seq samples
Zammit et al. (Banerji and Zammit 2019; Christopher R.S. Banerji 2017) derived PAX7-induced and suppressed genes and demonstrated the repression of PAX7 target genes as a biomarker of FSHD. Following their fashion of defining PAX7 score as the t-statistics comparing the set of PAX7-induced to suppressed genes in a given sample (Christopher R.S. Banerji 2017), the PAX7 score decreased progressively throughout the Mild, Moderate, IG-High, High and Muscle-low FSHD samples. This trend was explained as a global repression of PAX7 target genes in FSHD by Banerji’s studies. The landscape of the PAX7-target gene expression, however, suggested a more complex mis-regulation in FSHD samples: majority of PAX7-induced (68%) and suppressed (74%) genes showed mild-to-moderate up-regulation in more affected FSHD biopsies (IG-High and High), whereas a smaller portion of PAX7-induced (32%) and suppressed (26%) showed mild down-regulation.
Note: the code in this chapter are long and tidious and therefore was hidden. Ther original .Rmd contails all the code for analysis and can be found in our master github branch here.
7.1 PA7 scores and disease activity
A single sample of PAX7 socre is constructed as t-statistics comparing the log expression of PAX7-induced and suppressed genes within a sample ( Christopher R.S. Banerji 2017). The code chunk below loaded the existing PAX7 targeted genes, calculated the PAX7-score (per sample) and tidied the related data for further analysis.
load(file.path(pkg_dir, "public_data", "pax7_targets.rda"))
#' tidy the PAX7-targeted genes info
pax7_score <- sapply(colnames(sanitized.dds), function(sample_name) {
  data <- dplyr::select(pax7_targets, attribute, sample_name)
  tt <- t.test(x = data[data$attribute=="induced", sample_name],
               y = data[data$attribute=="suppressed", sample_name])
  c(t_stats=unname(tt$statistic), induced_mean=unname(tt$estimate[1]),
    suppressed_mean=unname(tt$estimate[2]))
})
# pax 7 rlog
pax7_score <- as.data.frame(t(pax7_score)) %>%
  rownames_to_column(var="sample_name") %>%
  mutate(pheno_type = sanitized.dds[, sample_name]$pheno_type) %>%
  left_join(cluster_df %>% dplyr::select(sample_name, new_cluster_name, RNA_cluster),
            by="sample_name") %>%
  mutate(cluster_name = ifelse(RNA_cluster == "A_Cntr", "Control",
                               as.character(new_cluster_name))) %>%
  mutate(cluster_name = factor(cluster_name, levels=c("Control", "Mild", "Moderate", "IG-High",
                               "High", "Muscle-Low")))
Shown below is boxplots of PAX7-score (t-statisitcs) by classes of FSHDs. The score decreased progressively from the Mild, Moderate, IG-High, High to Muscle-Low groups. This suggests that PAX7 targeted genes are associated with the disease activity. The question now is that what does the trend of decreasing PAX7-score reflect? Is it a global repression on PAX7-regualted genes w.r.t. the controls or else?
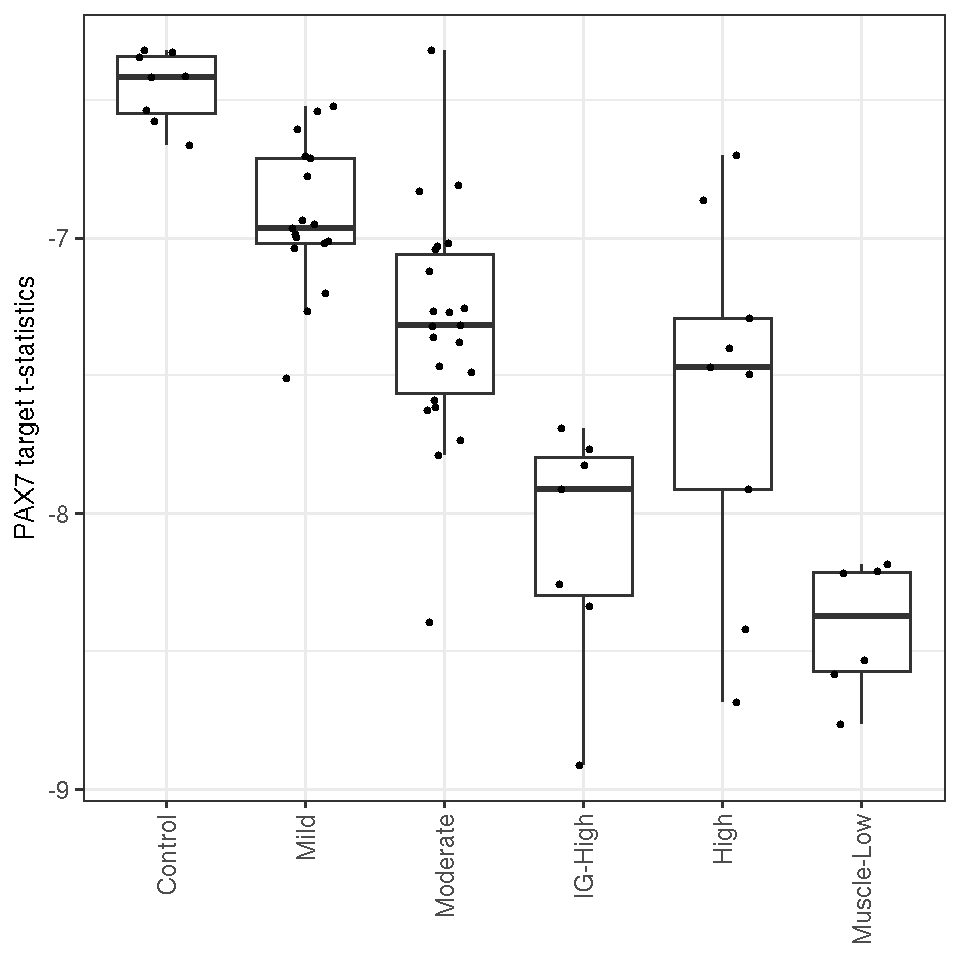
Figure 7.1: Boxplot of PAX7 scores by different FSHD classes.
7.2 Mis-regulation of PAX7-targeted gene
The heatmap below presents the row z-score of PAX7-induced and suppressed gene expression, columns gapped by FSHD categories and rows gapped by induced and suppressed genes. It suggests a complicated mis-regulation of PAX7-targeted genes in FSHDs relative to the controls. Majority of the PAX7 targeted (induced 68% and supressed 74%) gene expression were elevated in STIR+, DUX4+ samples (High class). A smaller portion of PAX7-induced (32%) and PAX7-supressed (24%) exhibited mild down-regulation in STIR+/DUX4+ FSHDs relative to controls (32% and 26% in -induced and -supressed, respectively). The progressive up-reguation in the PAX7-suppressed genes in Mild to High groups could be the driving force of the decreasing PAX7-score. Moreover, the violin plot below displays the expression distribution and shows the mean estimiates of the PAX7-suppressed expression are increasing from Mild, Moderate, IG-High, High to Muscle-Low groups whereas that of PAX7-induced expression remain almost invariable.
## # A tibble: 2 x 3
##   attribute  up_regulated down_reguated
##   <chr>             <dbl>         <dbl>
## 1 induced           0.681         0.319
## 2 suppressed        0.744         0.256
7.2.1 Heatmap showing mis-regulation
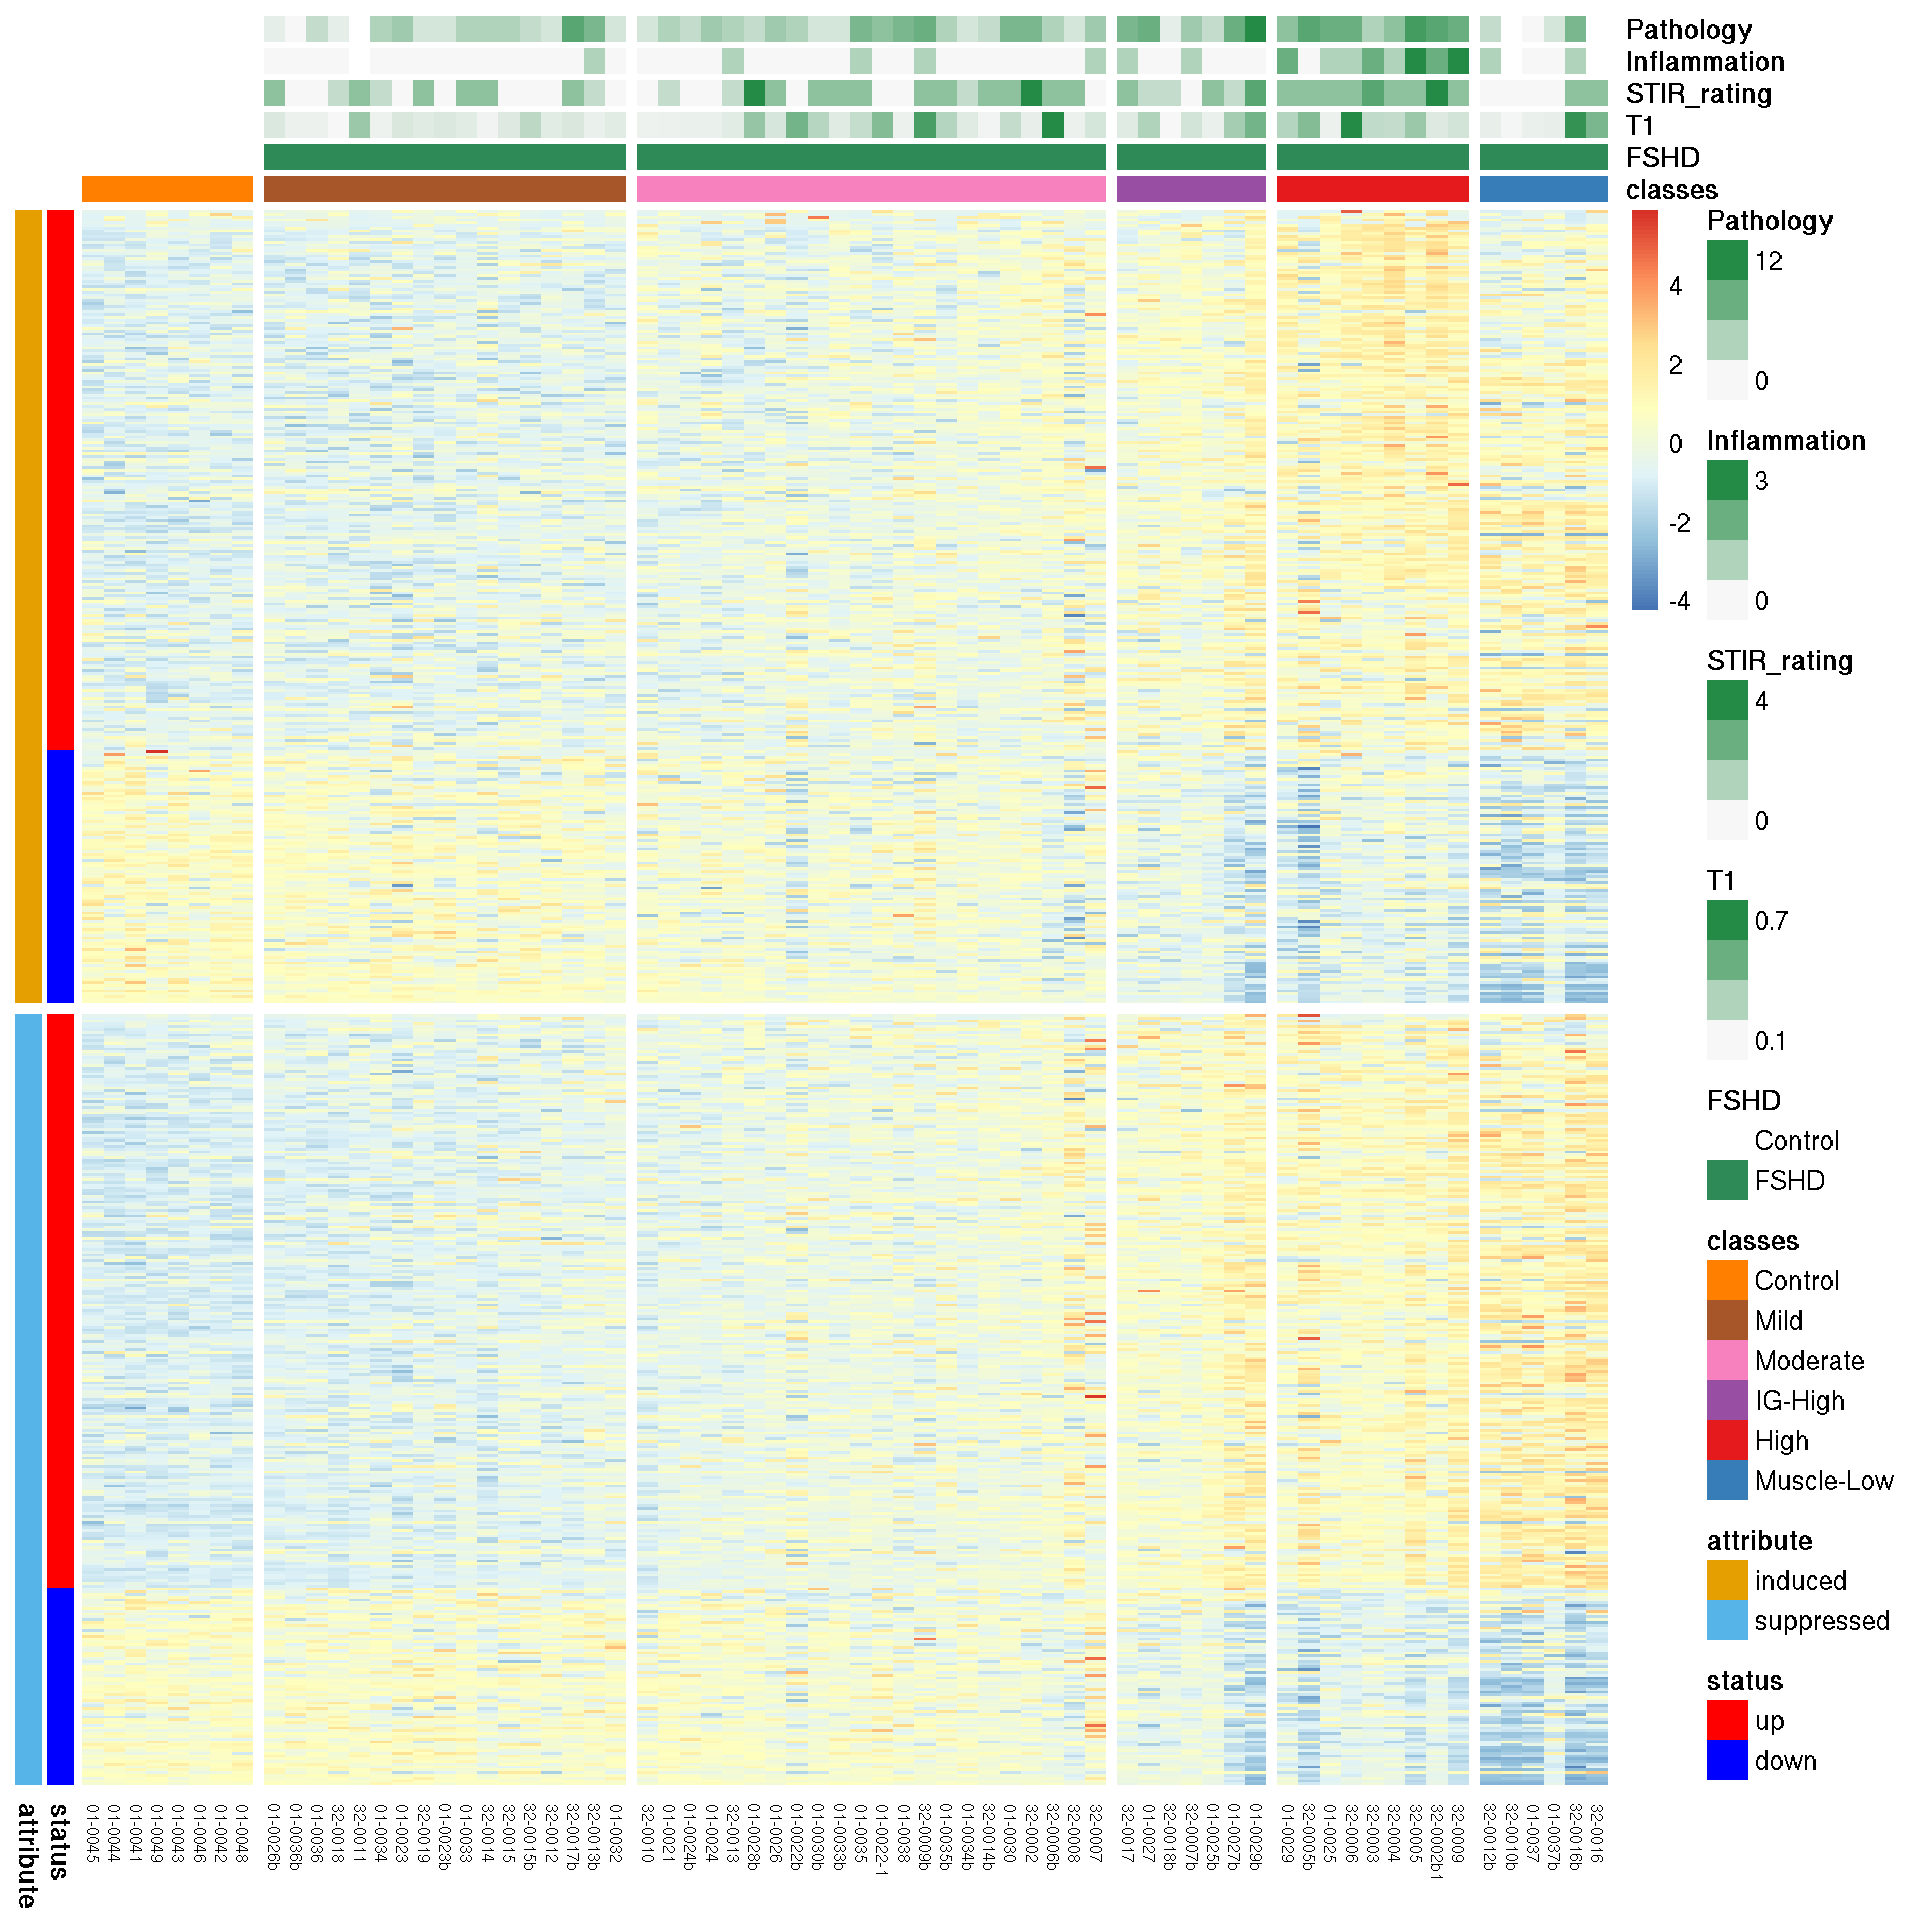
Figure 7.2: Heatmap of PAX7 targeted gene expression.
7.2.2 Violin plot of PAX7 targets expression
The violin plot below shows the distributions of PAX7-induced and suppressed genes by FSHD classes, illustrating the increasing means of PAX7-suppressed gene expression in more affected FSHD biopsies. The orange and blue dashed lines represent the mean values of PAX7-induced and suppressed genes in the controls, respectively. The orange and blue dots are the mean values of the PAX7-induced and suppression expression in different FSHD classes. The 95% confident intervals of means of PAX7-induced and suppressed gene expression display that the means difference of PAX7-induced gene expression between the controls and different FSHD groups are not significantly different.
## Warning in grid.Call.graphics(C_polygon, x$x, x$y, index): semi-
## transparency is not supported on this device: reported only once per page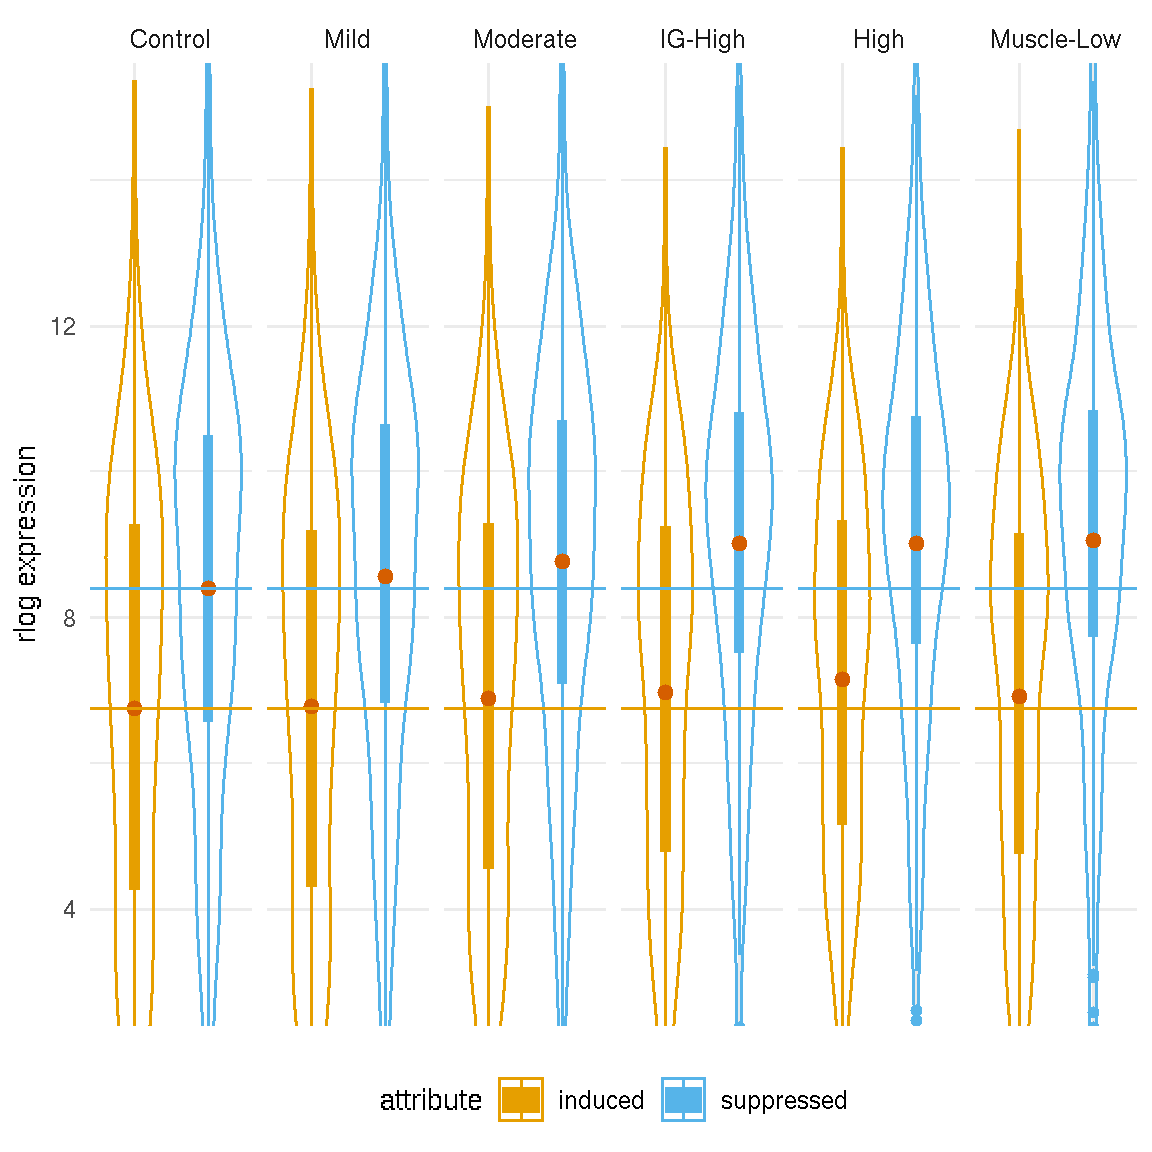
Figure 7.3: Density of average PAX7 target gene expression by categories. Dashed lines represent the mean values of the controls.
7.2.3 Observation of the 95% CI of the mean estimates
The mean estimates and their 95% confidence intervals (showing below) of PAX7-induced and suppressed gene expression illustrate that the mean differences of PAX7-induced gene expression between the controls and the FSHD groups are not significantly different. In contrast, the mean differences of PAX7-suppressed gene expression between the controls and more affected FSHD groups (IG-High, High and Muscle-Low) are more statisitcally significant. Thus the trend of decreasing PAX7 t-statistics score in FSHD groups does not reflect a globel repression but a mis-regulation of the PAX7 network genes.
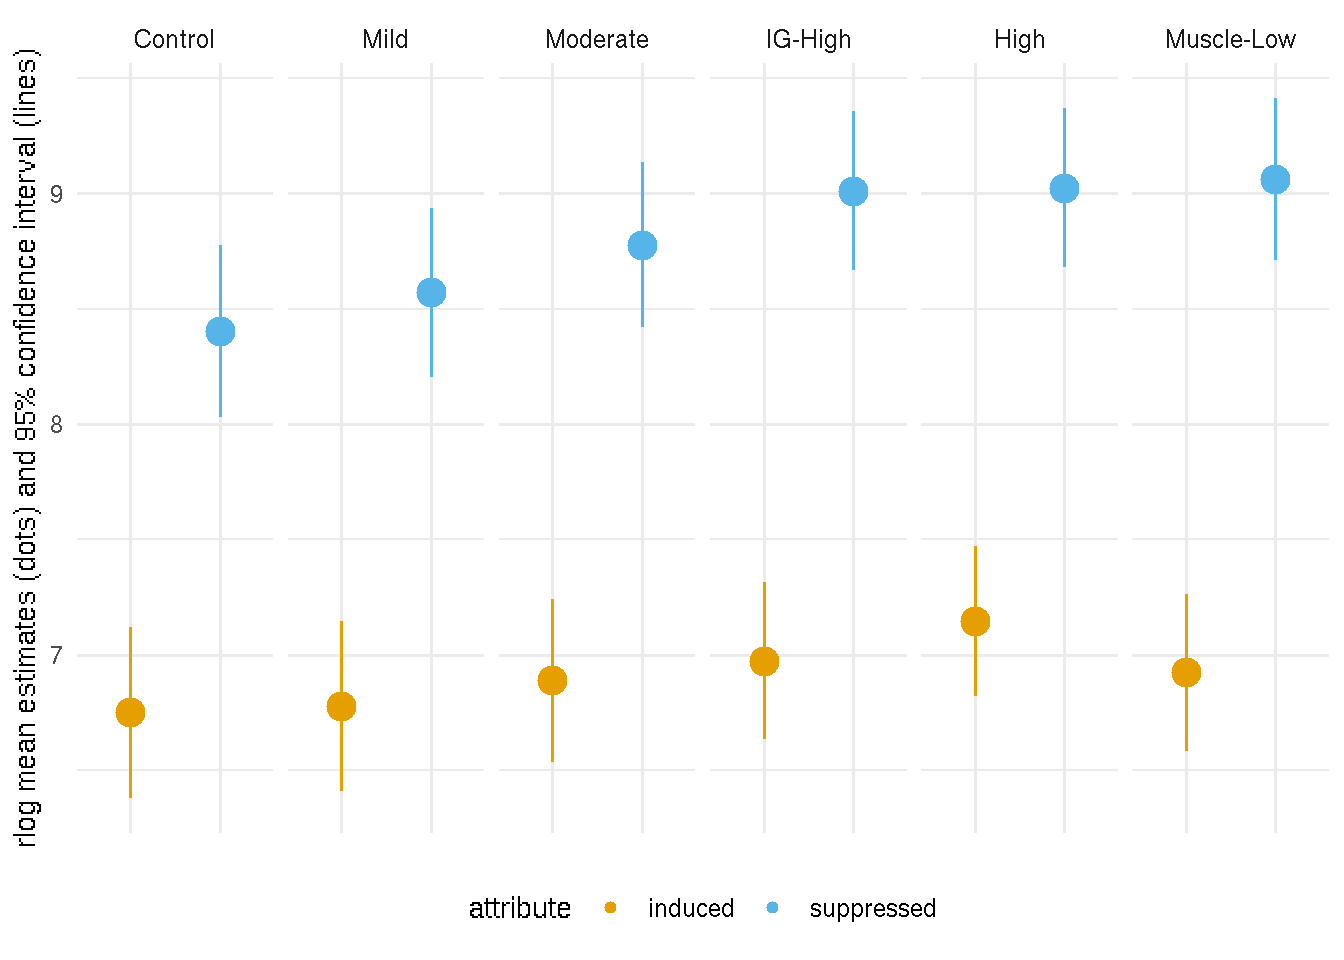
Figure 7.4: 95% confidence interval of means of PAX7-induced and suppressed gene expression. Dots represent mean estimates and lines 95% confidence interval
7.3 Compare to DUX4-targeted biomarkers
Next we use scatter plot (@ref{fig:pax7-scatter_control-vs-FSHD}) alon with linear regression to exam the association of the PAX7 targeted genes with the disease. The x-axis represents the average expression of PAX7 targeted genes in each FSHD category and y-axis the controls. The \(p\)-value was computed by two-sample Wilcox-test. The grey line represents a 1-to-1 relationship (x=y), and the blue line the linear regression of X and Y-axis. The linear regression lines do not deviate from \(x=y\). On the other hand, in the next scatter plot, a stronger, robust association between the DUX4 targeted genes (53 genes from Yao et al. 2014) and the disease activity is suggested by the linear regression and corresponding \(p\)-values.
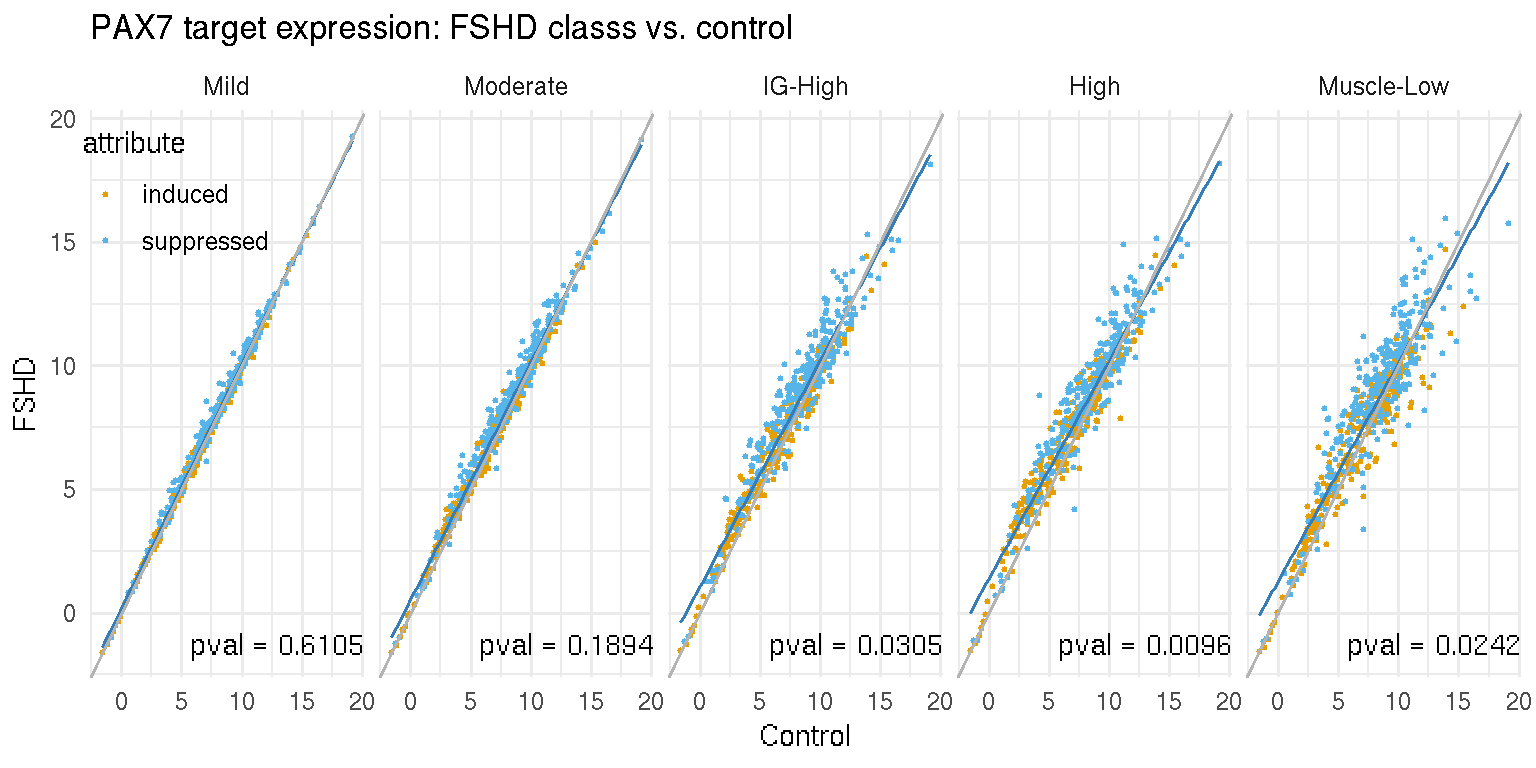
Figure 7.5: Scatter plot of average PAX7 targeted gene expression in the controls and each FSHD category.
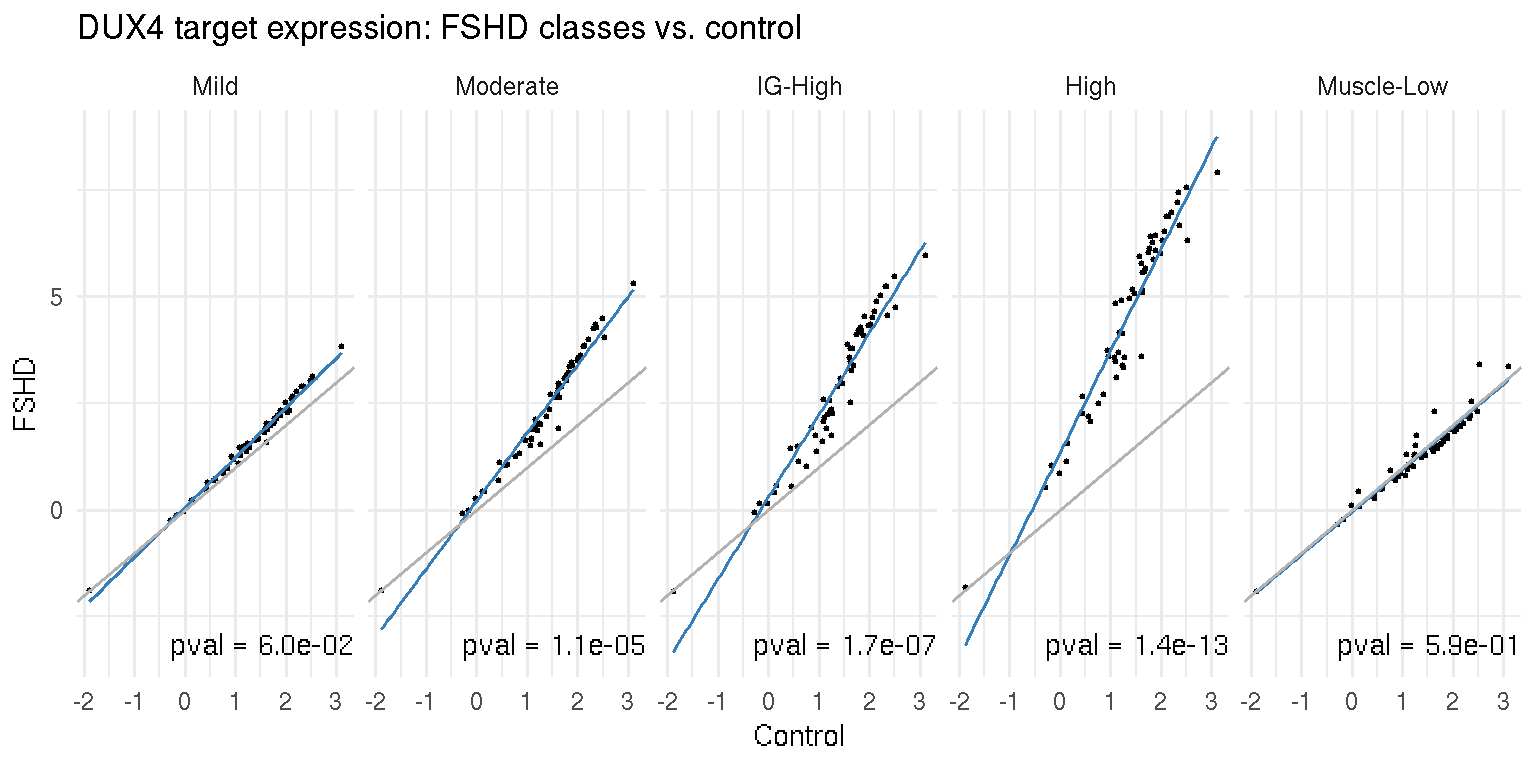
Figure 7.6: Scatter plot of average DUX4 targeted gene expression in the controls and each FSHD category.