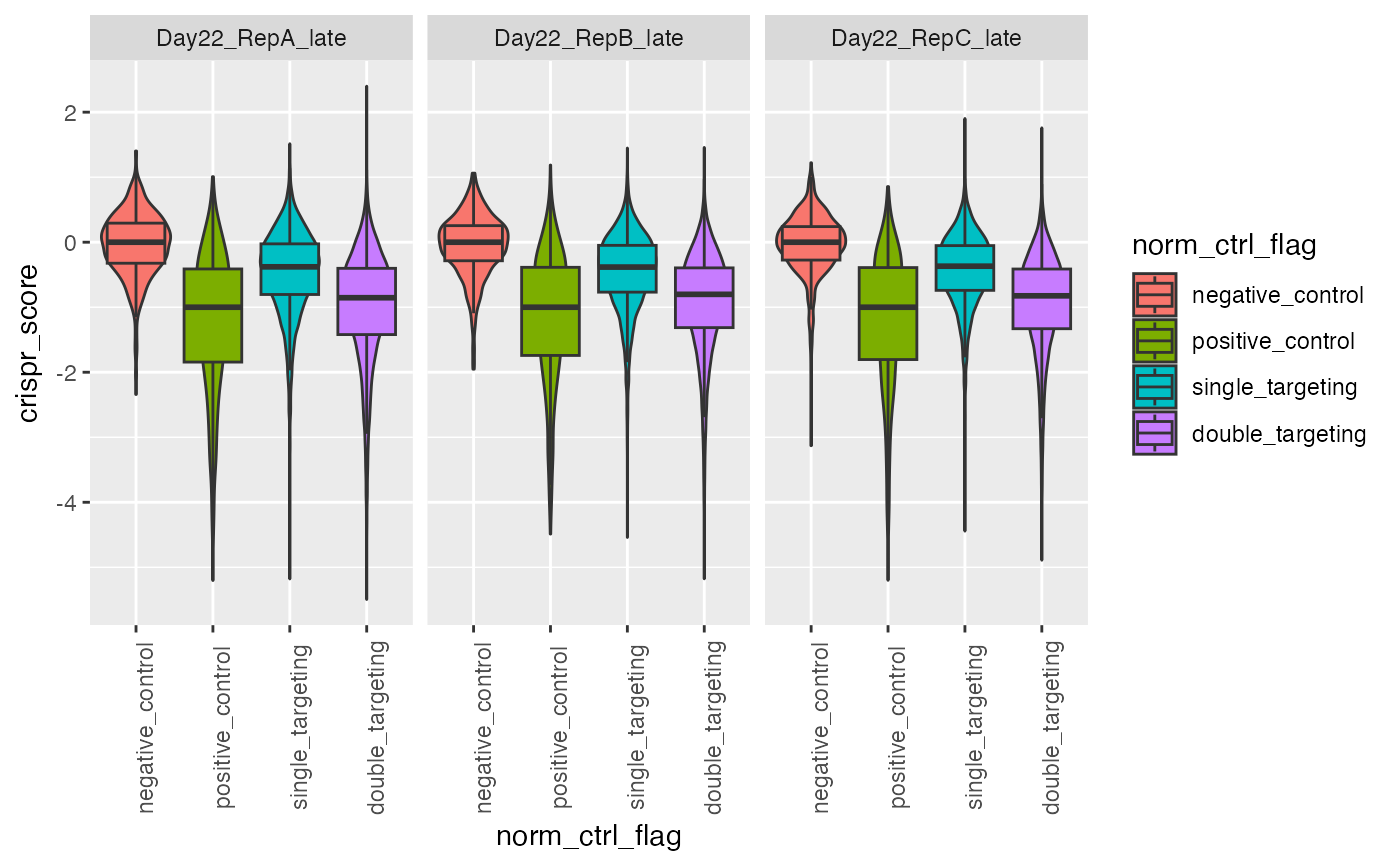
This plots normalization after CRISPR scores have been calculated
plot_crispr(.data = NULL, gimap_dataset, output_file = "crispr_norm_plot.png")Arguments
Value
A ggplot2 boxplot of the CRISPR scores separated by the type of target. Can be used to determine the normalization has proceeded properly.
Examples
# \donttest{

gimap_dataset <- get_example_data("gimap") %>%
  gimap_filter() %>%
  gimap_annotate(cell_line = "HELA") %>%
  gimap_normalize(
    timepoints = "day",
    missing_ids_file = tempfile()
  )
#> Annotating Data
#>
Downloading: 3.4 kB
Downloading: 3.4 kB
Downloading: 3.4 kB
Downloading: 3.4 kB
#> Downloading: Achilles_common_essentials.csv
#>
  |
  |                                                                      |   0%
  |
  |======================================================================| 100%
#>
  |
  |                                                                      |   0%
  |
  |===============================================                       |  67%
  |
  |======================================================================| 100%
#> Normalizing Log Fold Change

# Plot:
plot_crispr(gimap_dataset)

# }
# }