Create a histogram with plasmid log2 CPM values and ascertain a cutoff for low values
Source:R/plots-qc.R
qc_plasmid_histogram.RdFind the distribution of plasmid (day0 data) pgRNA log2 CPM values, and ascertain a cutoff or filter for low log2 CPM values. Assumes the first column of the dataset is the day0 data; do I need a better method to tell, especially if there are reps?
qc_plasmid_histogram(
  gimap_dataset,
  cutoff = NULL,
  filter_plasmid_target_col = NULL,
  wide_ar = 0.75
)
Arguments
- gimap_dataset
The special gimap_dataset from the `setup_data` function which contains the transformed data
- cutoff
default is NULL, the cutoff for low log2 CPM values for the plasmid time period; if not specified, The lower outlier (defined by taking the difference of the lower quartile and 1.5 * interquartile range) is used
- filter_plasmid_target_col
default is NULL, and if NULL, will select the first column only; this parameter specifically should be used to specify the plasmid column(s) that will be selected
- wide_ar
aspect ratio, default is 0.75
Value
a ggplot histogram
Examples
gimap_dataset <- get_example_data("gimap")
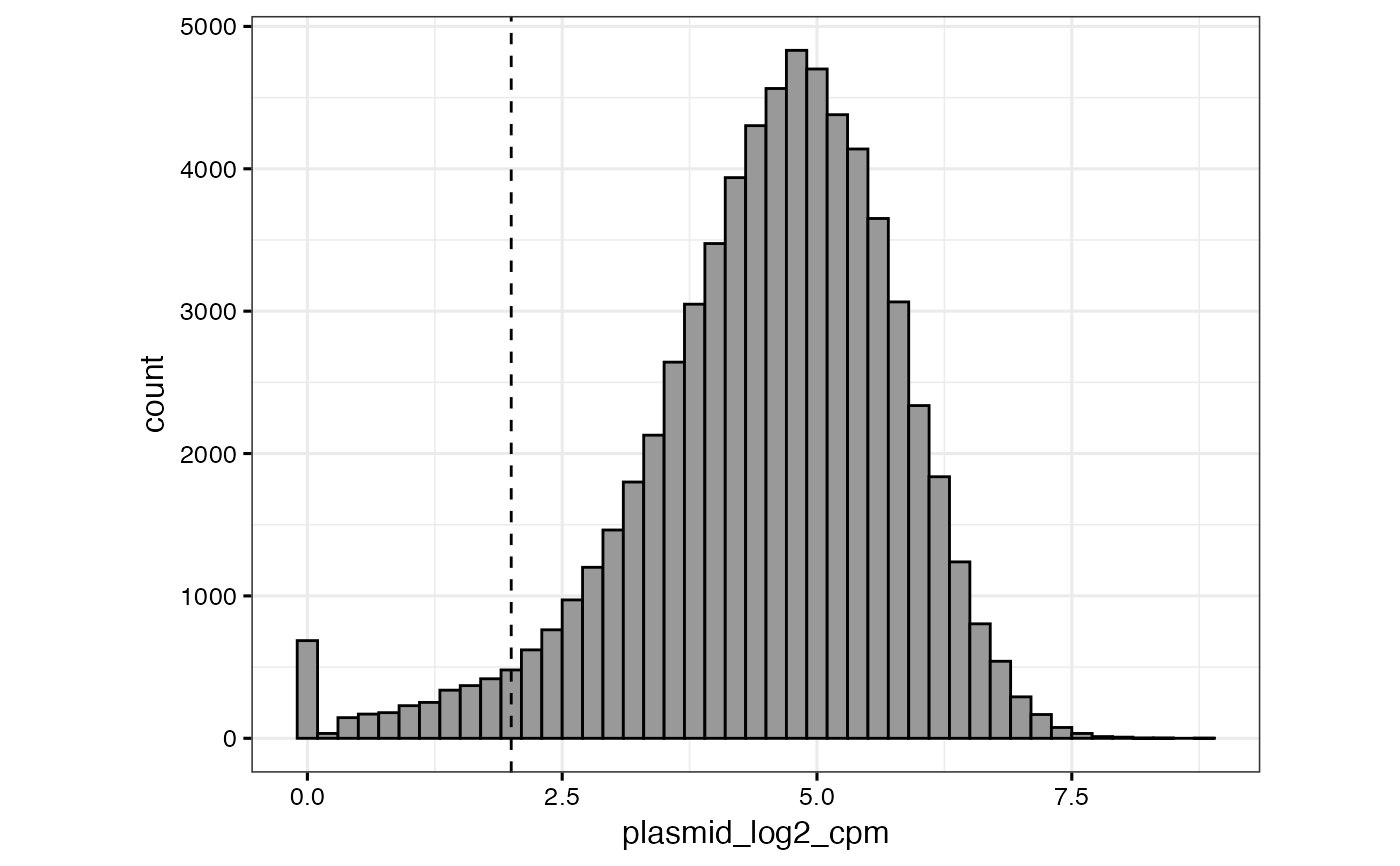
qc_plasmid_histogram(gimap_dataset)
 # or to specify a "cutoff" value that will be displayed as a dashed vertical line
qc_plasmid_histogram(gimap_dataset, cutoff = 1.75)
# or to specify a "cutoff" value that will be displayed as a dashed vertical line
qc_plasmid_histogram(gimap_dataset, cutoff = 1.75)
 # or to specify a different column (or set of columns) to select
qc_plasmid_histogram(gimap_dataset, filter_plasmid_target_col = 1:2)
# or to specify a different column (or set of columns) to select
qc_plasmid_histogram(gimap_dataset, filter_plasmid_target_col = 1:2)
 # or to specify a "cutoff" value that will be displayed as a dashed vertical
# line as well as to specify a different column (or set of columns) to select
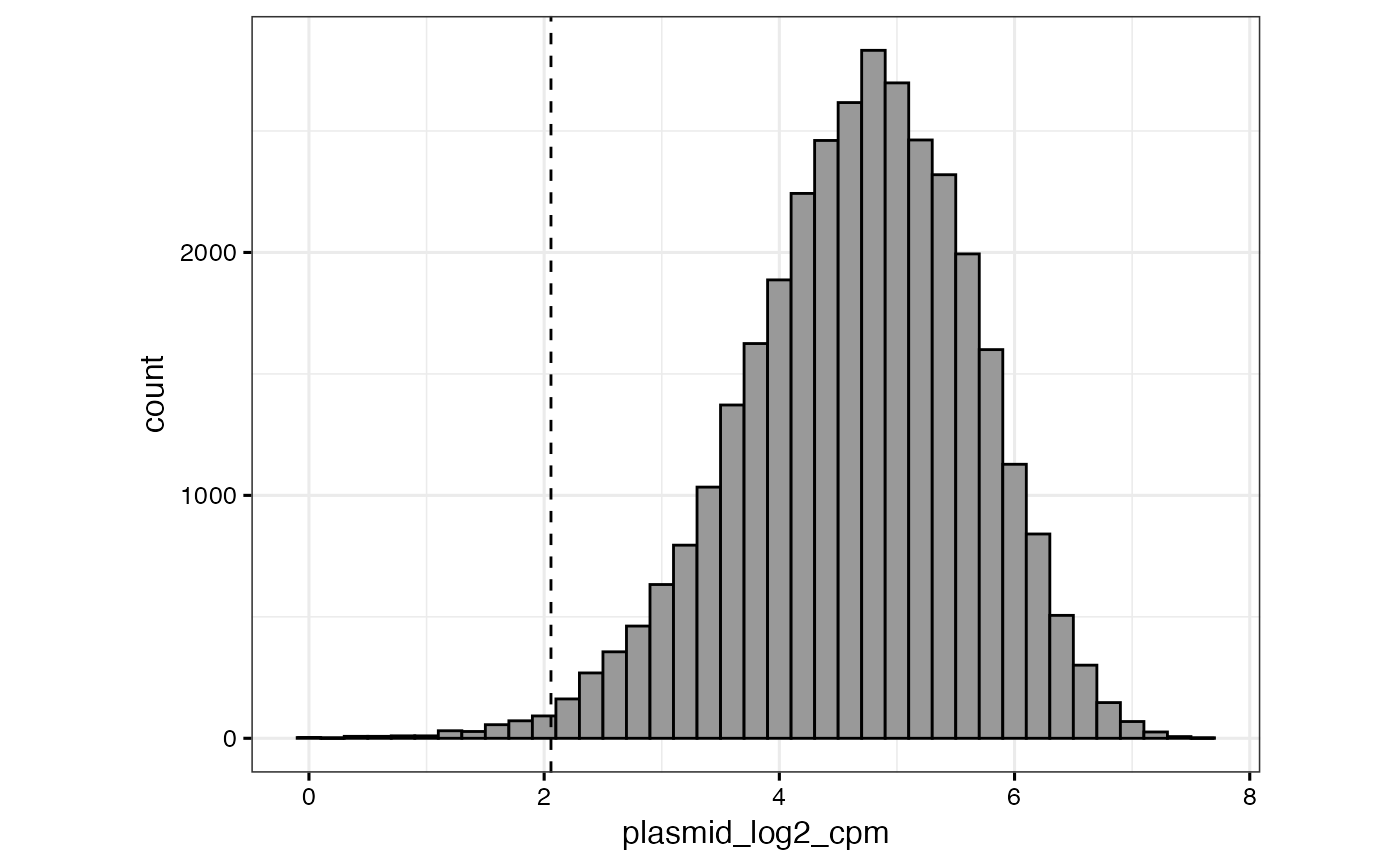
qc_plasmid_histogram(gimap_dataset, cutoff = 2, filter_plasmid_target_col = 1:2)
# or to specify a "cutoff" value that will be displayed as a dashed vertical
# line as well as to specify a different column (or set of columns) to select
qc_plasmid_histogram(gimap_dataset, cutoff = 2, filter_plasmid_target_col = 1:2)