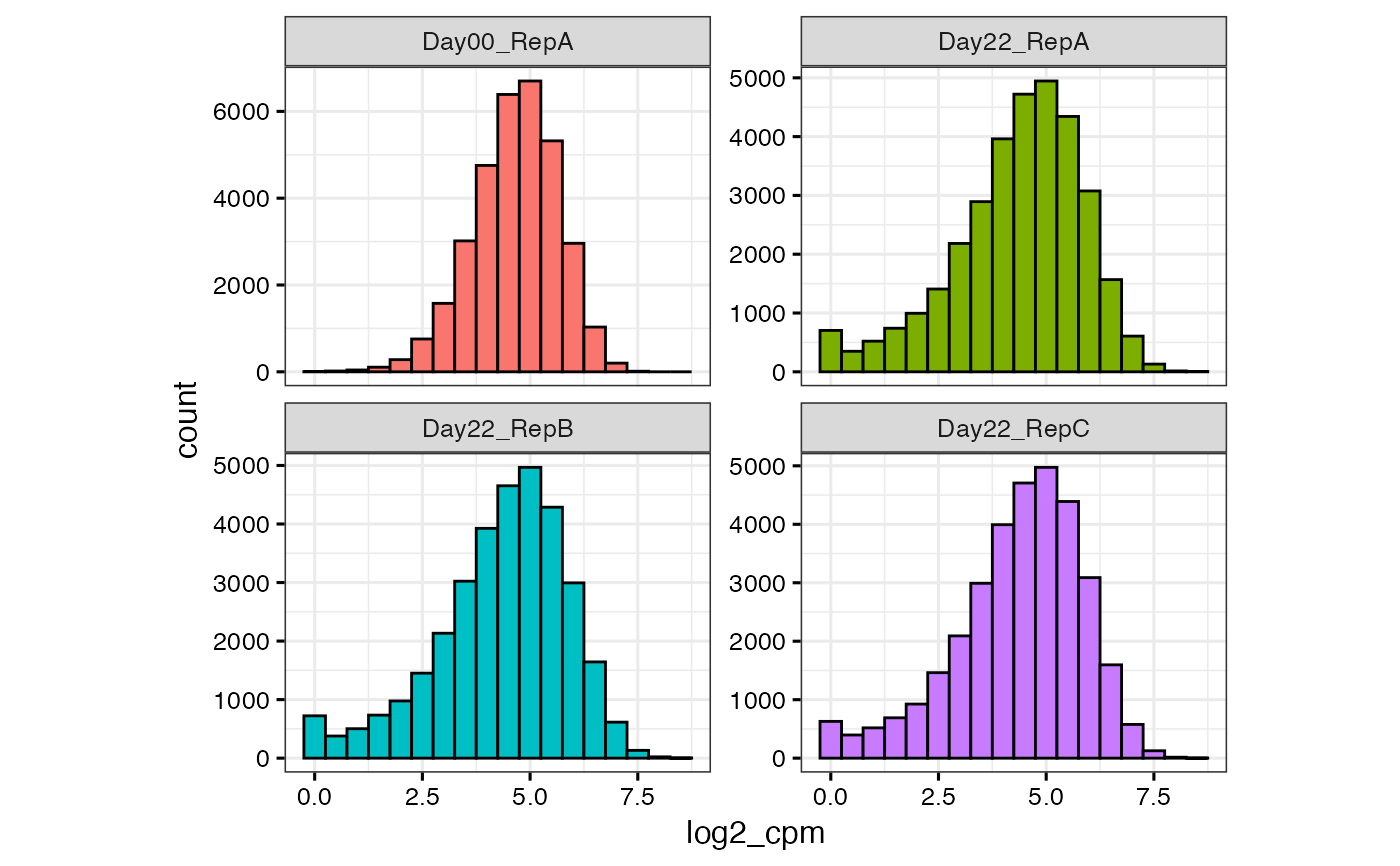
Create a histogram for the pgRNA log2 CPMs, faceted by sample
Source:R/plots-qc.R
qc_sample_hist.RdThis function uses pivot_longer to rearrange the data for plotting and then plots sample specific histograms of the pgRNA cpm's
qc_sample_hist(gimap_dataset, wide_ar = 0.75)Arguments
Value
sample_cpm_histogram a ggplot
Examples
gimap_dataset <- get_example_data("gimap")
qc_sample_hist(gimap_dataset)
