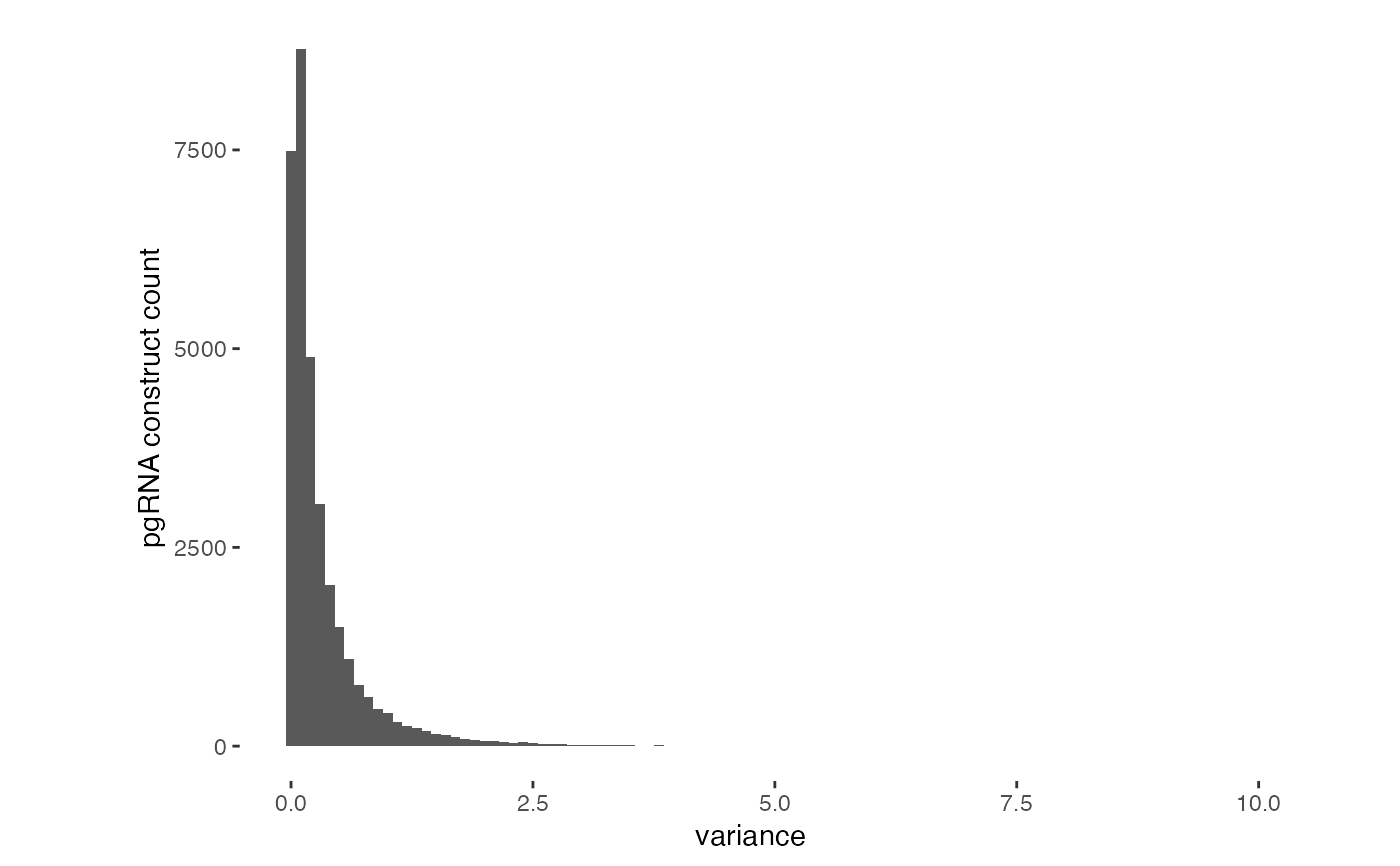
Create a histogram for the variance within replicates for each pgRNA
Source:R/plots-qc.R
qc_variance_hist.RdThis function uses pivot_longer to rearrange the data for plotting, finds the variance for each pgRNA construct (using row number as a proxy) and then plots a histogram of these variances
qc_variance_hist(
  gimap_dataset,
  filter_replicates_target_col = NULL,
  wide_ar = 0.75
)
Arguments
- gimap_dataset
The special gimap_dataset from the `setup_data` function which contains the transformed data
- filter_replicates_target_col
default is NULL; Which sample columns are replicates whose variation you'd like to analyze; If NULL, the last 3 sample columns are used
- wide_ar
aspect ratio, default is 0.75
Value
a ggplot histogram
Examples
gimap_dataset <- get_example_data("gimap")
qc_variance_hist(gimap_dataset)