6 Translation efficiency changes in CDS
The ribosome footprint (ribo-seq) and mRNA (RNA-seq) profiling allowed to determine changes in translation efficiency between two treatment groups. We employed a contrast model that calculated the logarithmic differences of the ratios between two groups in Ribo-seq and RNA-seq, with the null hypothesis defined as:
\[\begin{equation} H_0: \Bigg| log\left(\frac{treatment 2}{treatment 1}\right)_{ribo-seq} - log\left(\frac{treatment 2}{treatment 1}\right)_{RNA-seq} \Bigg| = 0, \tag{6.1} \end{equation}\] where the treatment 2 and 1 groups could be DUX-pulse+\(IFN_\gamma\) and \(IFN_\gamma\), respectively, or DUX-pulse and untreated.
In this chapter, we examined the effects of DUX4 on translation efficiency in CDS, specifically comparing DUX-pulse+\(IFN_\gamma\) to \(IFN_\gamma\). Here, we illustrate the steps and code used to discover any changes in translation efficiency.
6.1 Steps
To discover changes in translation efficiency induced by DUX4, we followed these steps:
- We defined genomic features that include gene-based CDS, as well as transcript-based features such as 5’ UTR, 13 nts up/downstream from translation start sites, first coding exons, and 3’ UTR. We then counted p-sites within these genomic features, as described in Chapter 4.
- Conducted non-specific filtering by excluding 92 histone1 (H1) and histone 2 (H2) variants, as well as DUX4- and \(IFN_\gamma\)-induced genes (as described in Chapter 5). We applied loose base-mean filtering to both RNA-seq and ribo-seq data.
- Pre-estimated size factor separately for RNA-seq and ribo-seq libraries using DESeq2 and p-site counts (ribo-seq) and gene counts (RNA-seq), irrespective of the genomic features.
- Applied loose base-mean non-specific filtering to avoid very low counts (noise)
- Performed hypothesis testing by applying the contrast model described above to DESeq2, using adjusted p-values < 0.05 and |logFC| > 1 as the thresholds for significant translation efficiency changes.
- Conducted GO term analysis for down-regulated translation changes.
6.2 Flowchart
knitr::include_graphics("./images/flowchart-translation-changes.png")
Figure 3.5: Flowchart to examine the translational efficiency changes induced by DUX4.
6.3 Load libraries and define parameters
Note that the main directory is named pkg_dir, and we have set it to our local path. The code chunks in this chapter are extracted from here.
library(DESeq2)
library(readxl)
library(writexl)
library(tidyverse)
library(corrr)
library(plyranges)
library(wesanderson)
library(goseq)
library(org.Hs.eg.db)
library(hg38.HomoSapiens.Gencode.v35)
data(gene.anno)
txdb <- hg38.HomoSapiens.Gencode.v35

library(BiocParallel)
bp_param=MulticoreParam(workers = 4L)
register(bp_param, default=TRUE)
# define parameters
pkg_dir <- "~/CompBio/DUX4-IFNg-ribosome-footprints"
stats_dir <- file.path(pkg_dir, "stats", "translation_changes", "CDS")
source(file.path(pkg_dir, "scripts", "06A-tools_TE.R"))
source(file.path(pkg_dir, "scripts", "tools.R"))
load(file.path(pkg_dir, "data", "dds_cds_by_gene.rda"))

my_color <- wesanderson::wes_palette("Darjeeling1", n=5)[2:5]
names(my_color) <- levels(dds_cds_by_gene$treatment)

# define comparison groups
list_comp <- list(S1 = c("untreated", "DOX_pulse"),
                  S2 = c("untreated", "IFNg"),
                  S3 = c("untreated", "DOX_pulse_IFNg"),
                  S4 = c("IFNg", "DOX_pulse"),
                  S5 = c("DOX_pulse", "DOX_pulse_IFNg"),
                  S6 = c("IFNg", "DOX_pulse_IFNg" ))
Next, we loaded the data sets of ribosome footprints and mRNA profiling as we as the genes to be remove from the analysis of translation efficiency changes.
#
# load rse by genes
#
load(file.path(pkg_dir, "data", "rse_cds_by_gene.rda"))
load(file.path(pkg_dir, "data", "rse_cds_mRNA.rda")) # cds by genes

#
# load DUX4_altered and INFg_altered
#
load(file.path(pkg_dir, "data", "DUX4_induced_v2.rda")) # LFC > 1
load(file.path(pkg_dir, "data", "IFNg_induced_v2.rda")) # LFC > 1

#
# identify H1 and H2 variants and PSM subunits
#
histone_variants <- .histone_variants(gene.anno)
exclude_gene <- c(histone_variants$gene_id, DUX4_induced_v2$ensembl)
psm_name <- readxl::read_xlsx(file.path(pkg_dir, "extdata", "Gene Lists_Proteasome_MHC-I.xlsx"),
                              sheet=1, range="A4:B49")
PSM <- as.data.frame(gene.anno) %>% dplyr::select(gene_name, gene_id) %>%
  dplyr::filter(gene_name %in% psm_name$Symbol)
6.4 DESeq2: DUX4+\(IFN_\gamma\) vs. \(IFN_\gamma\) in CDS
The code chunks below perform DESeq2’s differential analysis using a designated contrast model (as mentioned above) to discover translation efficiency changes in DUX4+\(IFN_\gamma\) relative \(IFN_\gamma\) in CDS.
# S6: use .comb_RNA_Ribo to combine mRNA and ribosome profilings and
# define design matrix to be used by DESeq2
dds_S6 <- .comb_RNA_Ribo(rse_rna = rse_cds_mRNA,
                         rse_ribo = rse_cds_by_gene,
                         treatments=list_comp[["S6"]],
                         rna_mean_filter=10, ribo_mean_filter=5)
dds_S6 <- dds_S6[!rownames(dds_S6) %in% exclude_gene]
dds_S6 <- DESeq(dds_S6)
#resultsNames(dds_S6)
S6_ribo_over_rna <- results(dds_S6,
                            name="protocolRibo.treatmentDOX_pulse_IFNg",
                            alpha=0.05) # translation efficiency changes
S6_rna <- results(dds_S6,
                  name="treatment_DOX_pulse_IFNg_vs_IFNg", alpha=0.05)
S6_ribo <- results(dds_S6,
                   contrast=list(c("treatment_DOX_pulse_IFNg_vs_IFNg",
                                   "protocolRibo.treatmentDOX_pulse_IFNg")),
                   alpha=0.05)
Next we tidied the result and made a scatter plot for the log fold changes between DUX-pulse and \(IFN_\gamma\) in ribo-seq and in RNA-seq.
# tidy the results and exclude DUX4-induced genes
tidy_S6_v2 <- .tidy_res_ribo_over_rna(dds=dds_S6,
                                      inter_res=S6_ribo_over_rna,
                                      ribo_res=S6_ribo, rna_res=S6_rna,
                                      alpha=0.05, lfc_threshold=1) %>%
             dplyr::filter(!ensembl %in% DUX4_induced_v2$ensembl) %>%
             dplyr::mutate(IFNg_induced_v2 = ensembl %in% IFNg_induced_v2$ensembl)

# scatter plot between log2FC in ribo-seq and in RNA-seq
res <- tidy_S6_v2
msg_up   <- sprintf("log2(Ribo / RNA) > 1: %4.0f", sum(res$status == "up"))
msg_down <- sprintf("log2(Ribo / RNA) < -1: %4.0f", sum(res$status == "down"))
pearson <- cor(res$rna_lfc, res$ribo_lfc)
label_x_pos <- 0
label_y_pos <- -2.5

ggplot(res, aes(x=rna_lfc, y=ribo_lfc)) +
  geom_point(size=2, alpha=0.5, aes(color=status, shape=IFNg_induced_v2)) +
  theme_bw() +
  annotate("text", x=label_x_pos, y=label_y_pos, label=paste0("Pearson = ", format(pearson, digit=2)),
           hjust = 0, vjust=1) +
  annotate("text", x=label_x_pos, y=label_y_pos-0.5, label=msg_up, color="red",
           hjust = 0, vjust=1) +
  annotate("text", x=label_x_pos, y=label_y_pos-1, label=msg_down,
           color="blue", hjust=0, vjust=1) +
  scale_color_manual(values=c("gray75", "red", "blue")) +
  scale_shape_manual(values=c(19, 1)) +
  theme(panel.grid.minor = element_blank(),
        plot.title = element_text(hjust = 0.5),
        legend.position="bottom", legend.box="vertical") +
  labs(x=bquote(~"RNA-seq:" ~log[2]~"(DOX_pulse_IFNg / IFNg)"),
       y=bquote(~"Ribo-seq:" ~log[2]~"(DOX_pulse_IFNg / IFNg)"),
title="Ribo-seq vs. RNA-seq (exclude DUX4-induced)", shape="IFNg-induced") 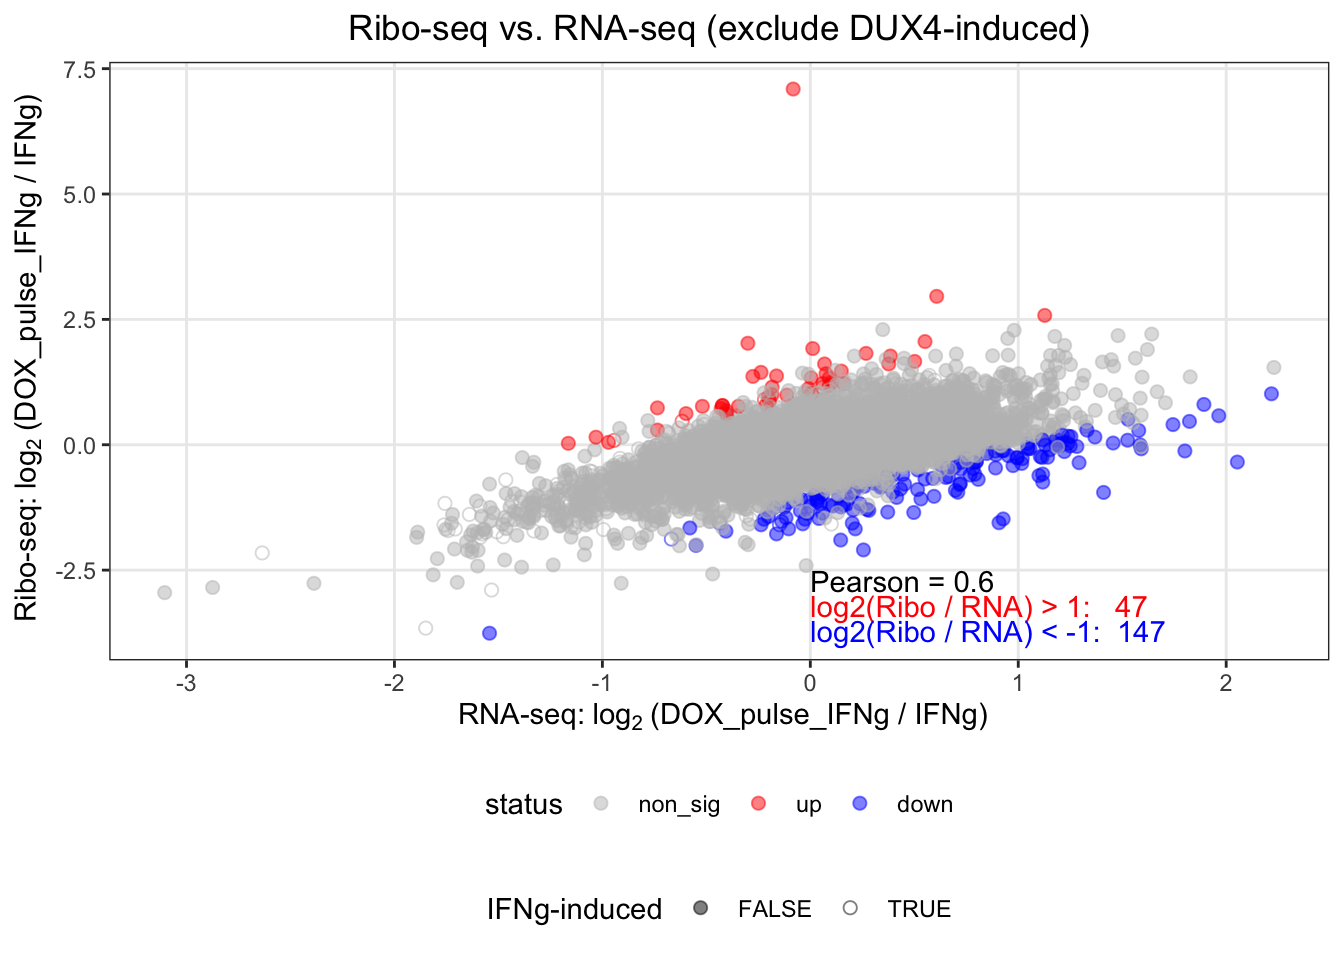
Figure 6.1: Scatter plot of log fold changes between DUX-pulse and IFN in ribo-seq and in RNA-seq. Blue dots indicate down-regulated translation efficiency changes and red up-regulated.
6.5 GO term analysis
# take down-regulated translation efficiency and use goseq to find the
# affected GO terms. Display the top 10.
interested <- tidy_S6_v2 %>% dplyr::filter(status=="down")
universal <- tidy_S6_v2 %>% pull(ensembl) %>% str_replace("\\..*", "")
selected <- interested %>% pull(ensembl) %>% str_replace("\\..*", "")
enriched_go <- .do_goseq(universal=universal, selected_gene=selected,  p_value=0.3,
                         return.DEInCat=FALSE, dds=dds_S6)
knitr::kable(enriched_go[1:10, ], caption="Top 10 enriched GO terms determined by down-regulated translation efficiency induced by DUX4." )| category | over_represented_pvalue | numDEInCat | numInCat | term | ontology | padj |
|---|---|---|---|---|---|---|
| GO:0019219 | 0.0000025 | 60 | 2702 | regulation of nucleobase-containing compound metabolic process | BP | 0.0232240 |
| GO:0051252 | 0.0000033 | 56 | 2466 | regulation of RNA metabolic process | BP | 0.0232240 |
| GO:0006355 | 0.0000562 | 49 | 2239 | regulation of DNA-templated transcription | BP | 0.1278336 |
| GO:1903506 | 0.0000578 | 49 | 2241 | regulation of nucleic acid-templated transcription | BP | 0.1278336 |
| GO:2001141 | 0.0000625 | 49 | 2248 | regulation of RNA biosynthetic process | BP | 0.1278336 |
| GO:0045605 | 0.0000644 | 3 | 6 | negative regulation of epidermal cell differentiation | BP | 0.1278336 |
| GO:0045683 | 0.0000644 | 3 | 6 | negative regulation of epidermis development | BP | 0.1278336 |
| GO:0006351 | 0.0000857 | 50 | 2339 | DNA-templated transcription | BP | 0.1346224 |
| GO:0097659 | 0.0000872 | 50 | 2340 | nucleic acid-templated transcription | BP | 0.1346224 |
| GO:0032774 | 0.0001018 | 50 | 2355 | RNA biosynthetic process | BP | 0.1414823 |