Learn more

GiG Map

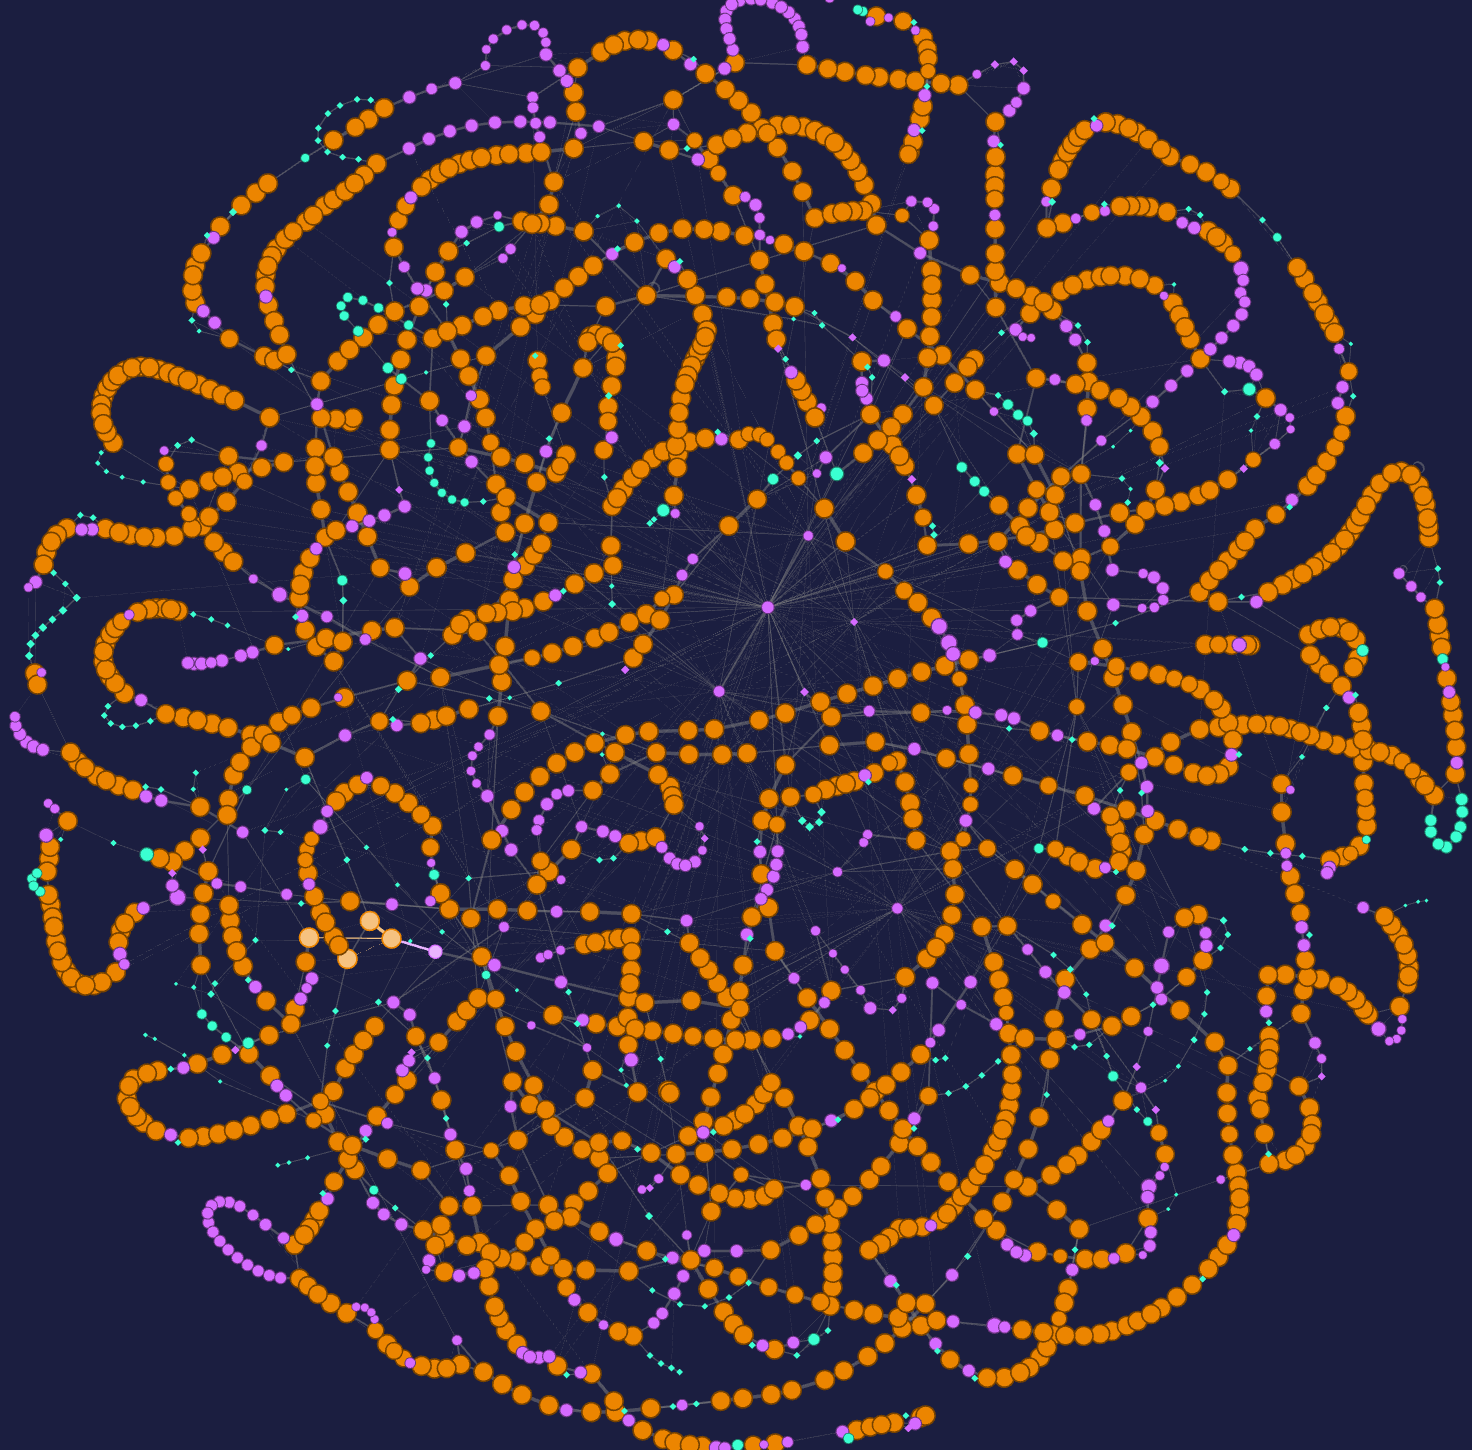
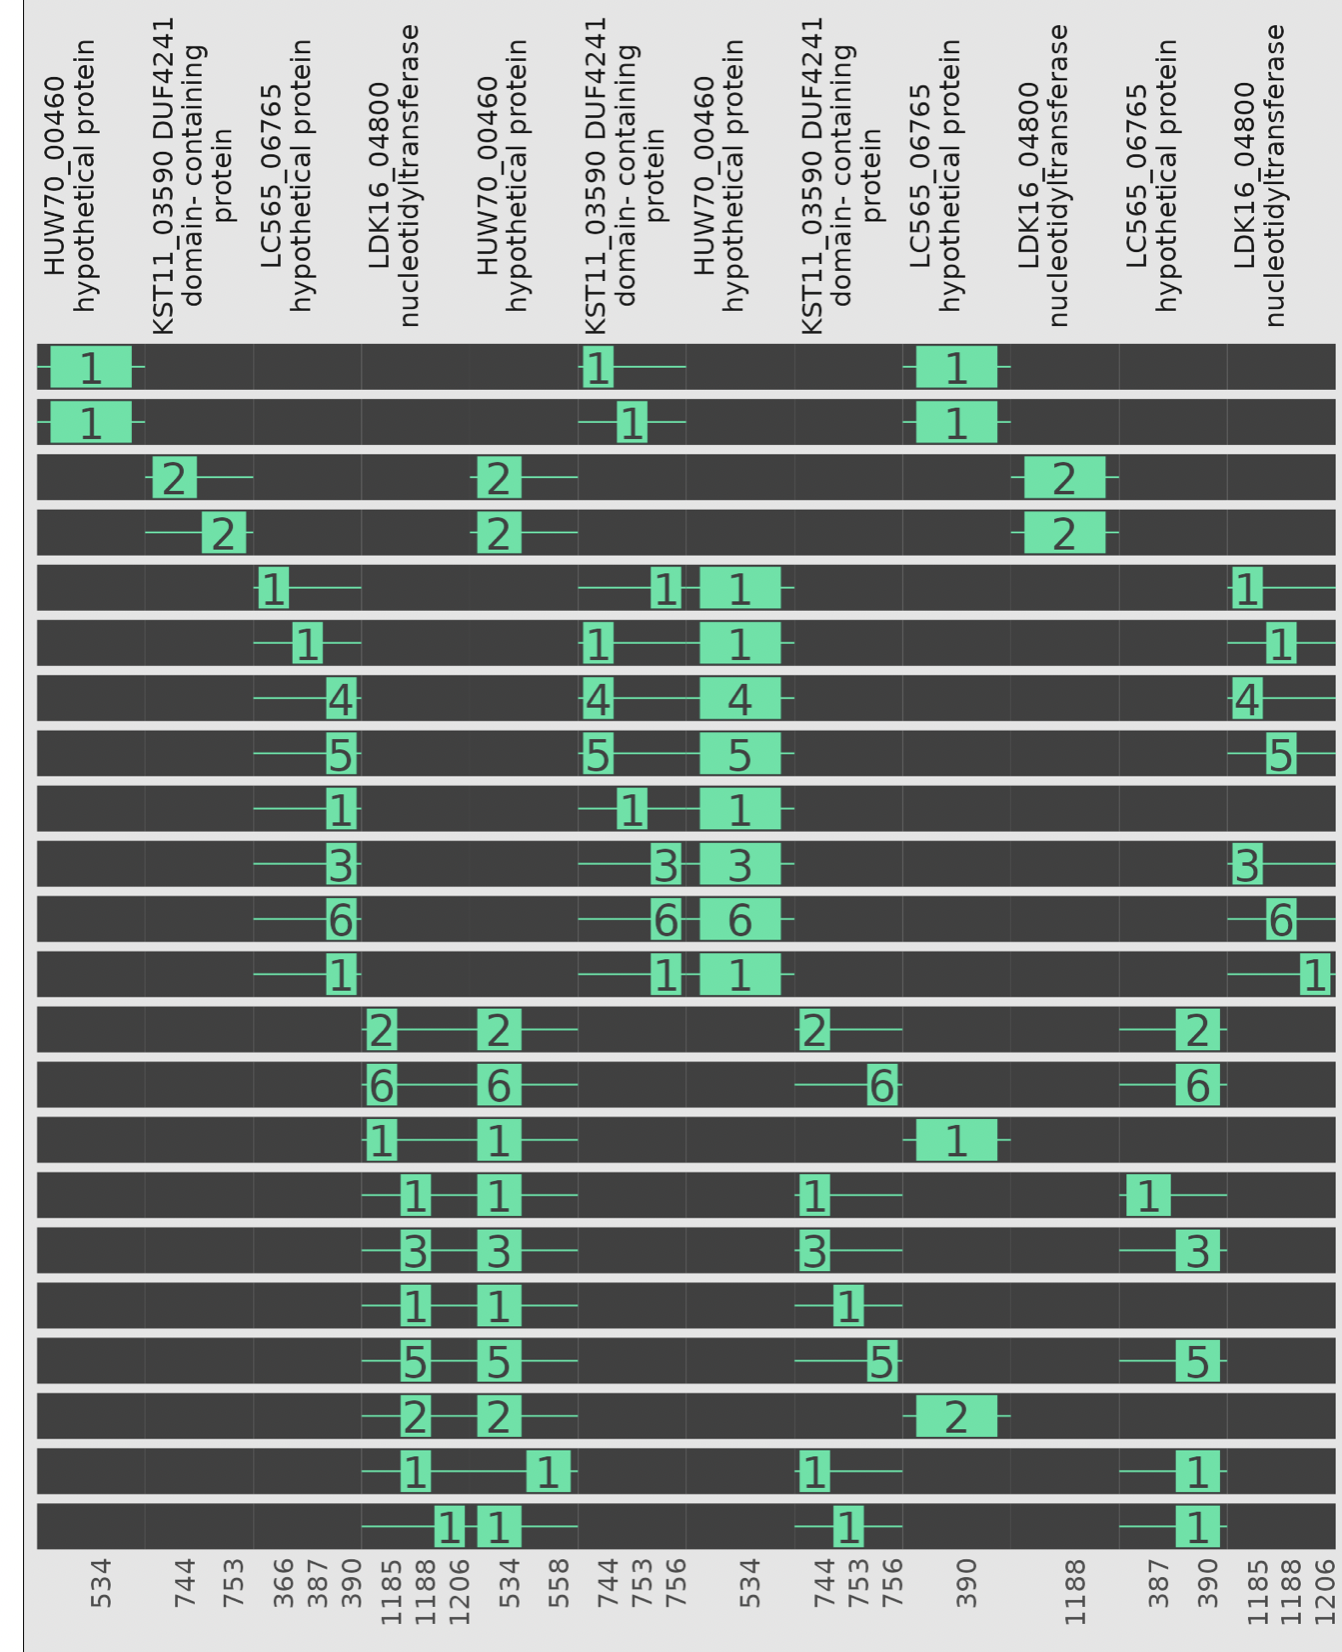
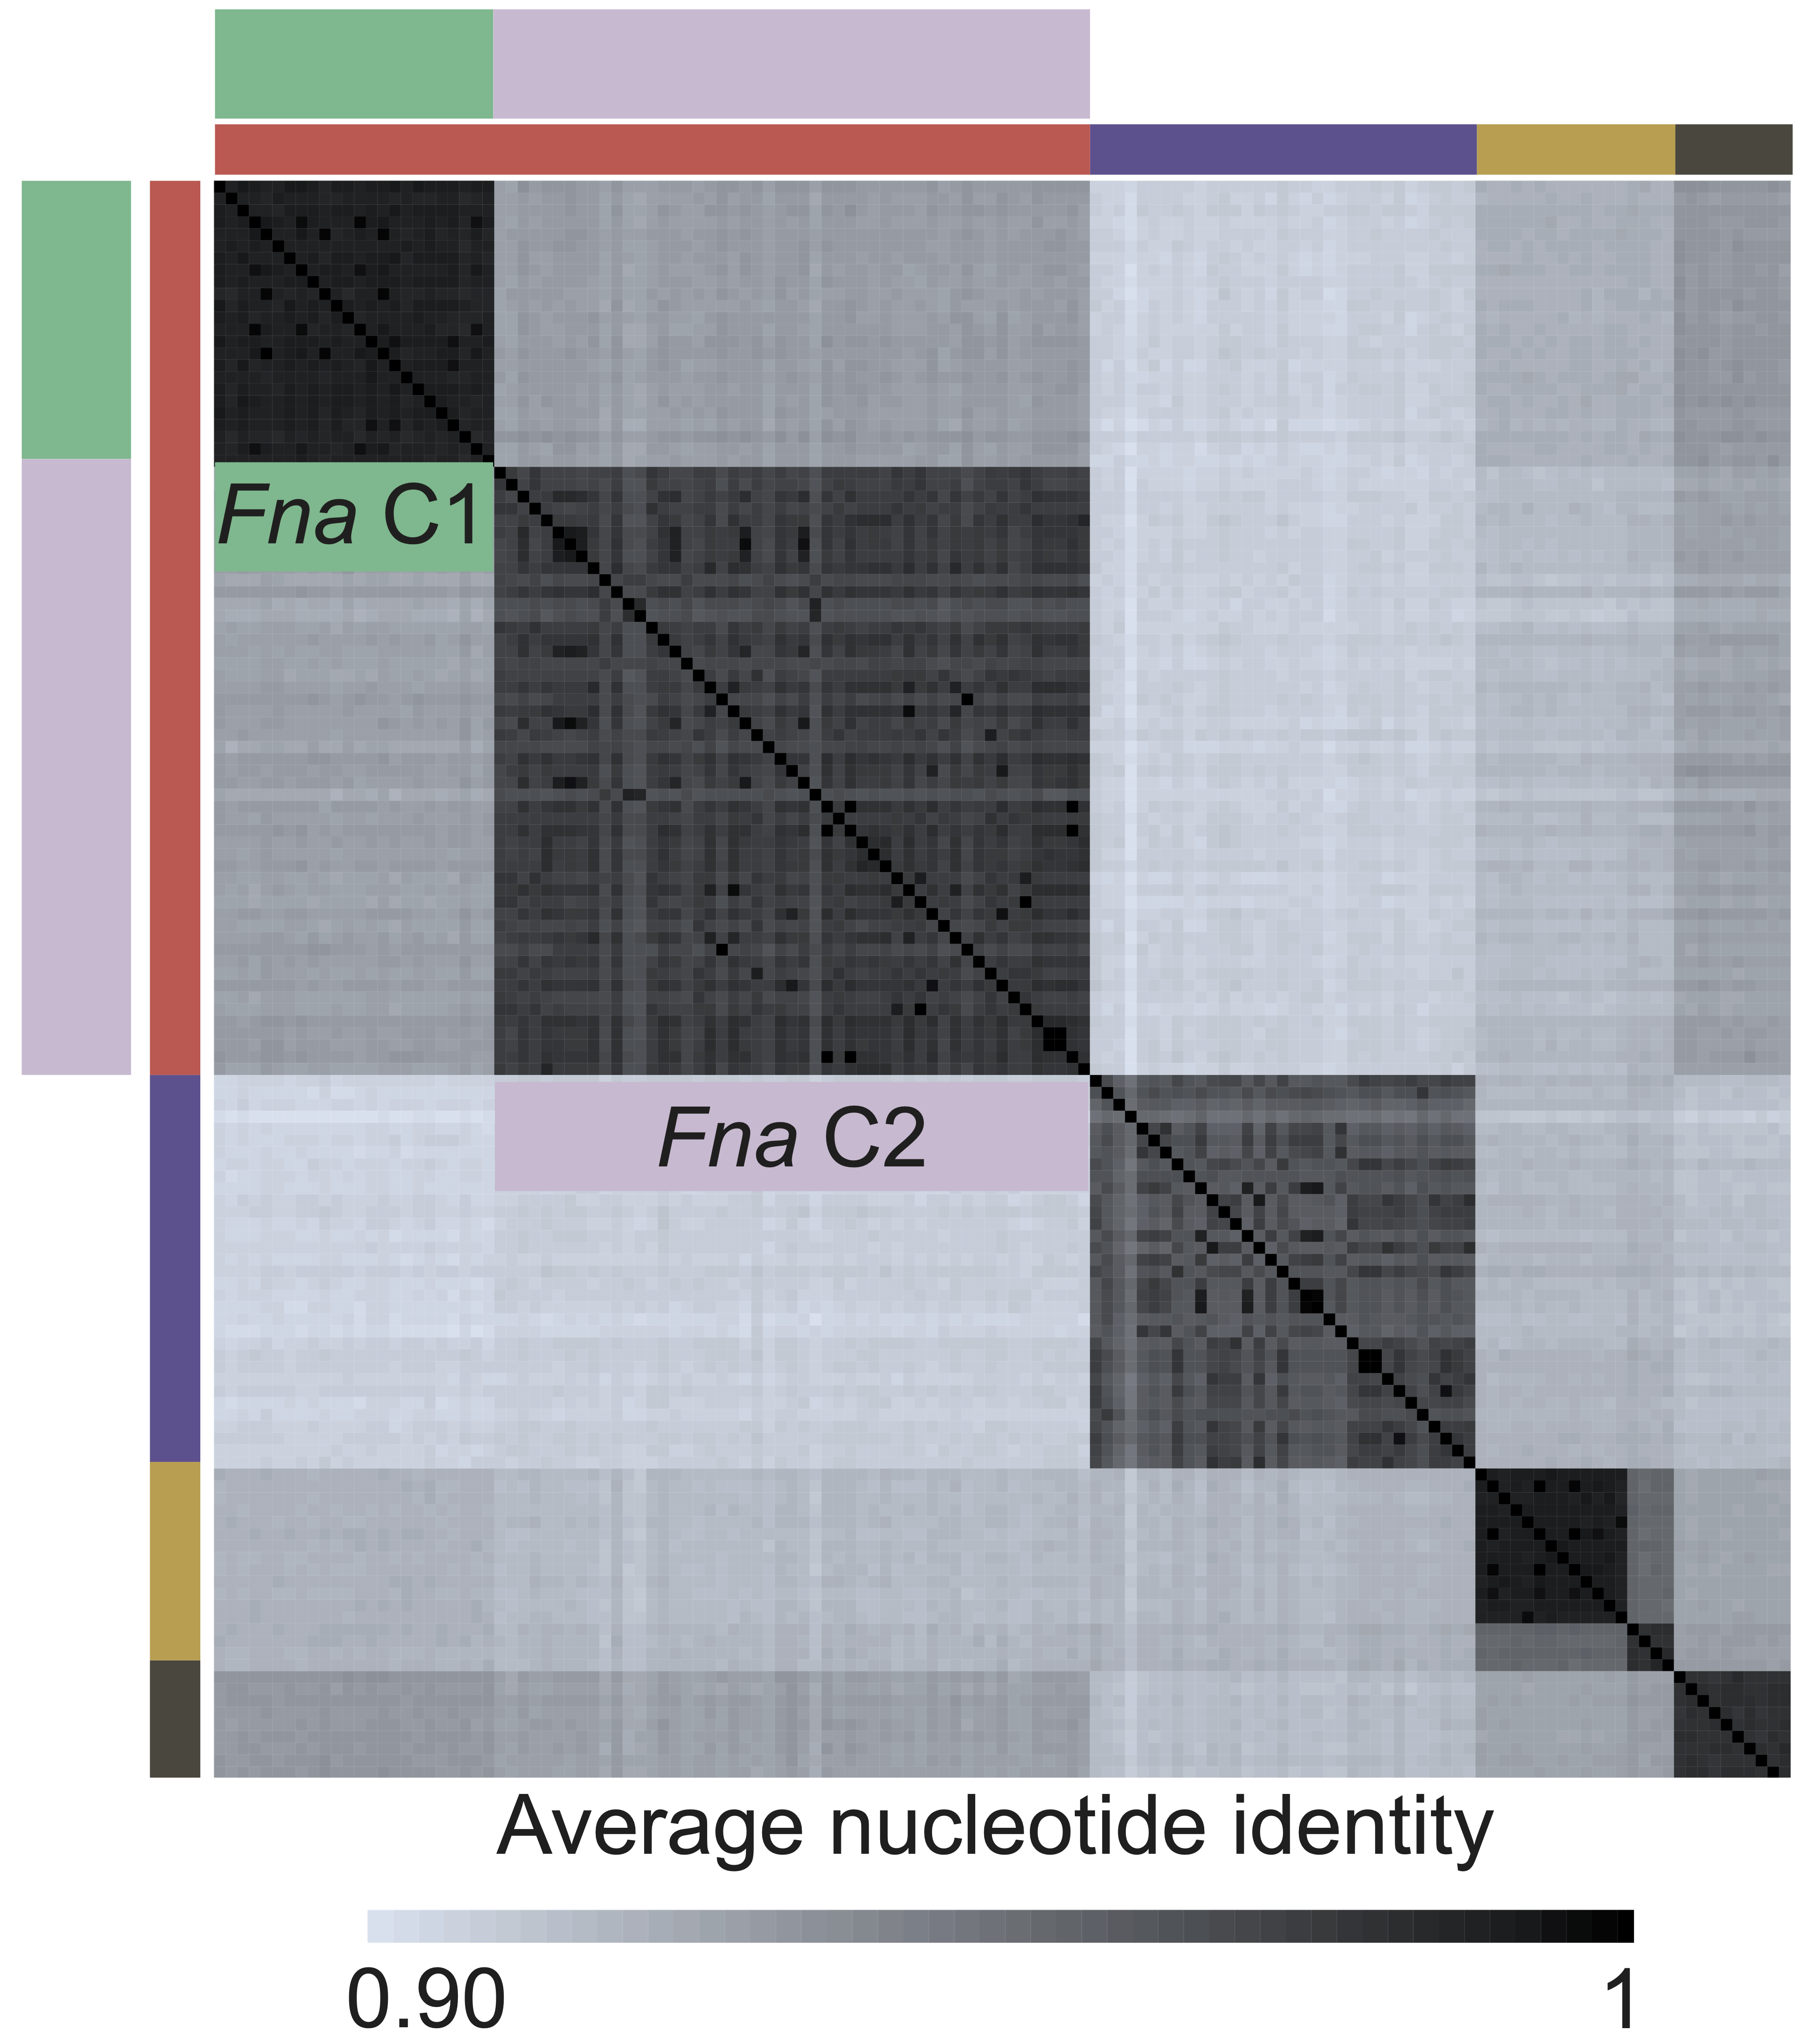
A heatmap resulting from the alignment of a set of genes against a set of genomes (to create a similarity score) alongside a phylogenetic tree of genome similarity. Additional information is shown by adding categorical annotations of the genomes.

To learn more or create your own GiG Map.
gig map example

PPanGGOLiN Partitioned Pangenome Graph

PPanGGOLiN builds pangenomes through a graphical model and a statistical method to partition gene families in persistent, shell and cloud genomes. It integrates both information on protein-coding genes and their genomic neighborhood to build a graph of gene families where each node is a gene family and each edge is a relation of genetic contiguity. The partitioning method promotes that two gene families that are consistent neighbors in the graph are more likely to belong to the same partition.

To learn more or create your own PPanGGOLiN cluster analysis.
fuso animalis pangenome

PPanGGOLiN Modules

PPanGGOLiN Modules are groups of genes that are part of the variable genome. They are often found together in the different genomes. As such, they are conserved modules and potential functional modules.

modules

kSNP Tree

kSNP identifies single nucleotide polymorphisms (SNPs) based on k-mer analysis and using these k-mers generates a reference-free phylogenetic tree.

tree

ANI

Average Nucleotide Identity (ANI) is a well-established index that measures the similarity between two genomes. The established species threshold is an ANI of 95% similarity.

ANI

Explore more

About us!