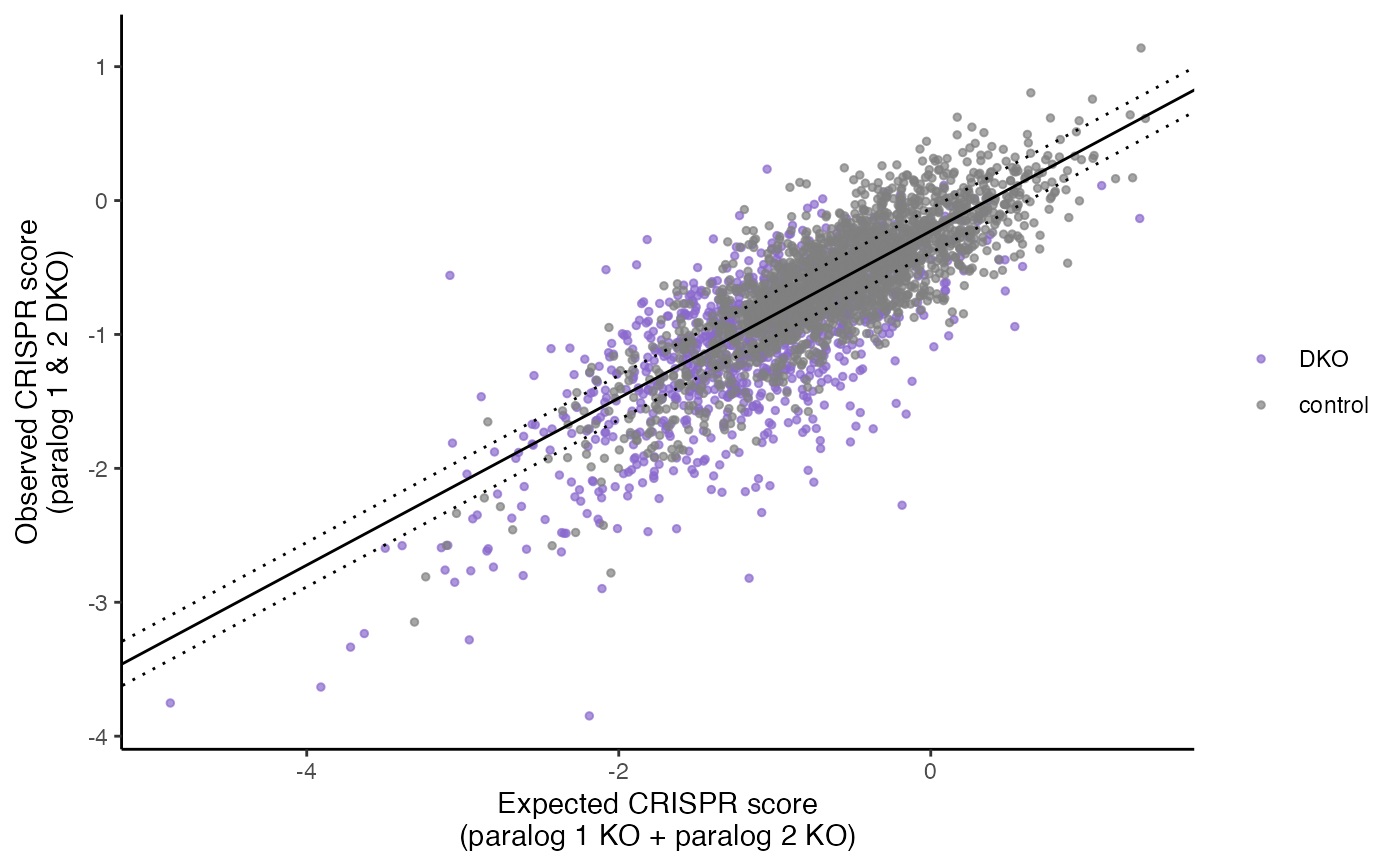
This plot is meant to be functionally equivalent to Fig S5K (for HeLa, equivalent of Fig 3a for PC9). Scatter plot of target-level observed versus expected CRISPR scores in the screen. The solid line is the linear regression line for the negative control (single KO) pgRNAs, while dashed lines indicate the lower and upper quartile residuals.
plot_exp_v_obs_scatter(gimap_dataset, facet_rep = FALSE)Arguments
Value
A ggplot2 scatterplot of the target level observed vs expected CRISPR scores.
Examples
# \donttest{
gimap_dataset <- get_example_data("gimap") %>%
gimap_filter() %>%
gimap_annotate(cell_line = "HELA") %>%
gimap_normalize(
timepoints = "day",
missing_ids_file = tempfile()
) %>%
calc_gi()
#> Annotating Data
#>
Downloading: 3.4 kB
Downloading: 3.4 kB
Downloading: 3.4 kB
Downloading: 3.4 kB
#> Downloading: Achilles_common_essentials.csv
#>
|
| | 0%
|
|======================================================================| 100%
#>
|
| | 0%
|
|=============================================== | 67%
|
|======================================================================| 100%
#> Normalizing Log Fold Change
#> Calculating Genetic Interaction scores
# To plot results
plot_exp_v_obs_scatter(gimap_dataset)
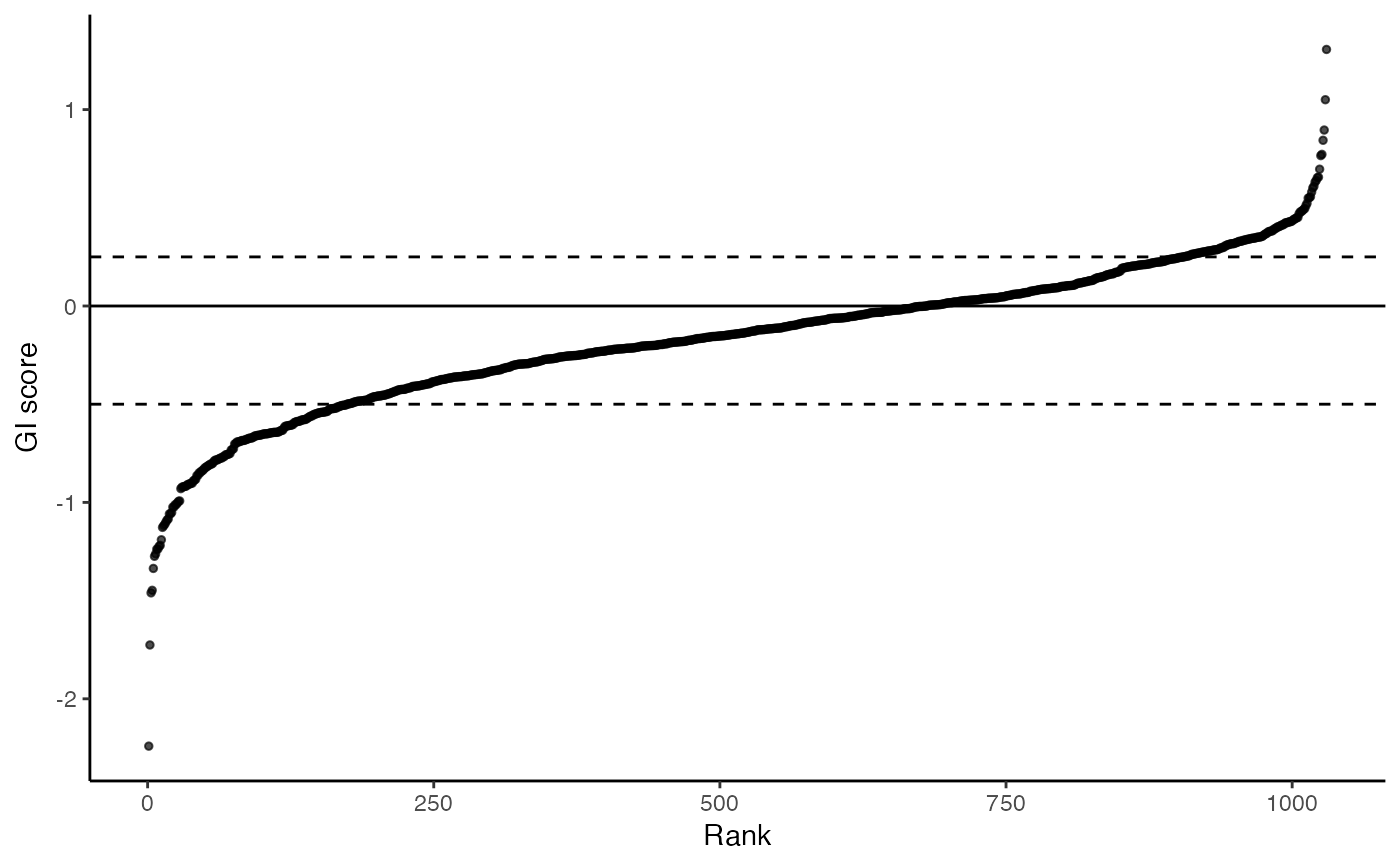
 plot_rank_scatter(gimap_dataset)
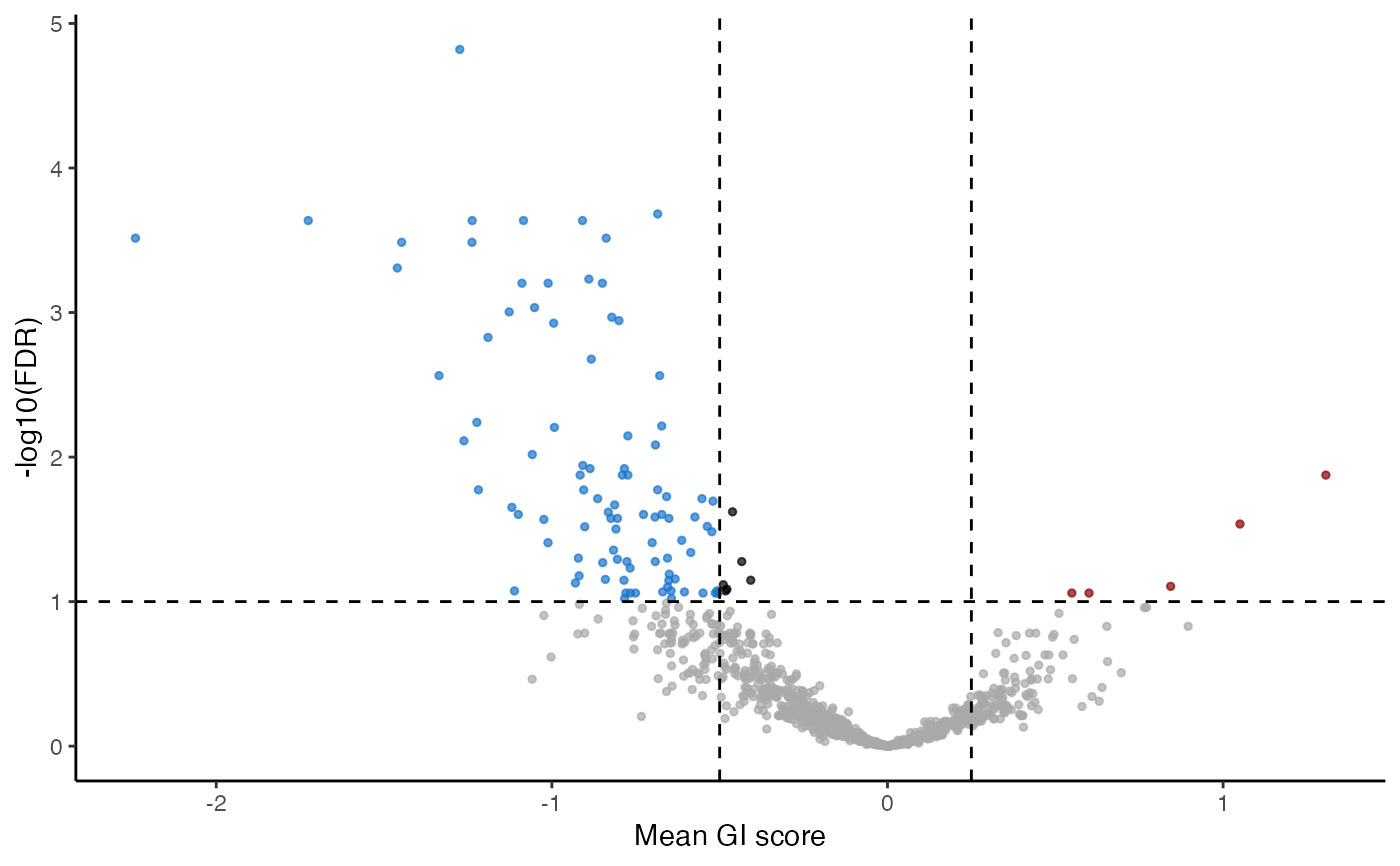
 plot_volcano(gimap_dataset)
 # }
# }