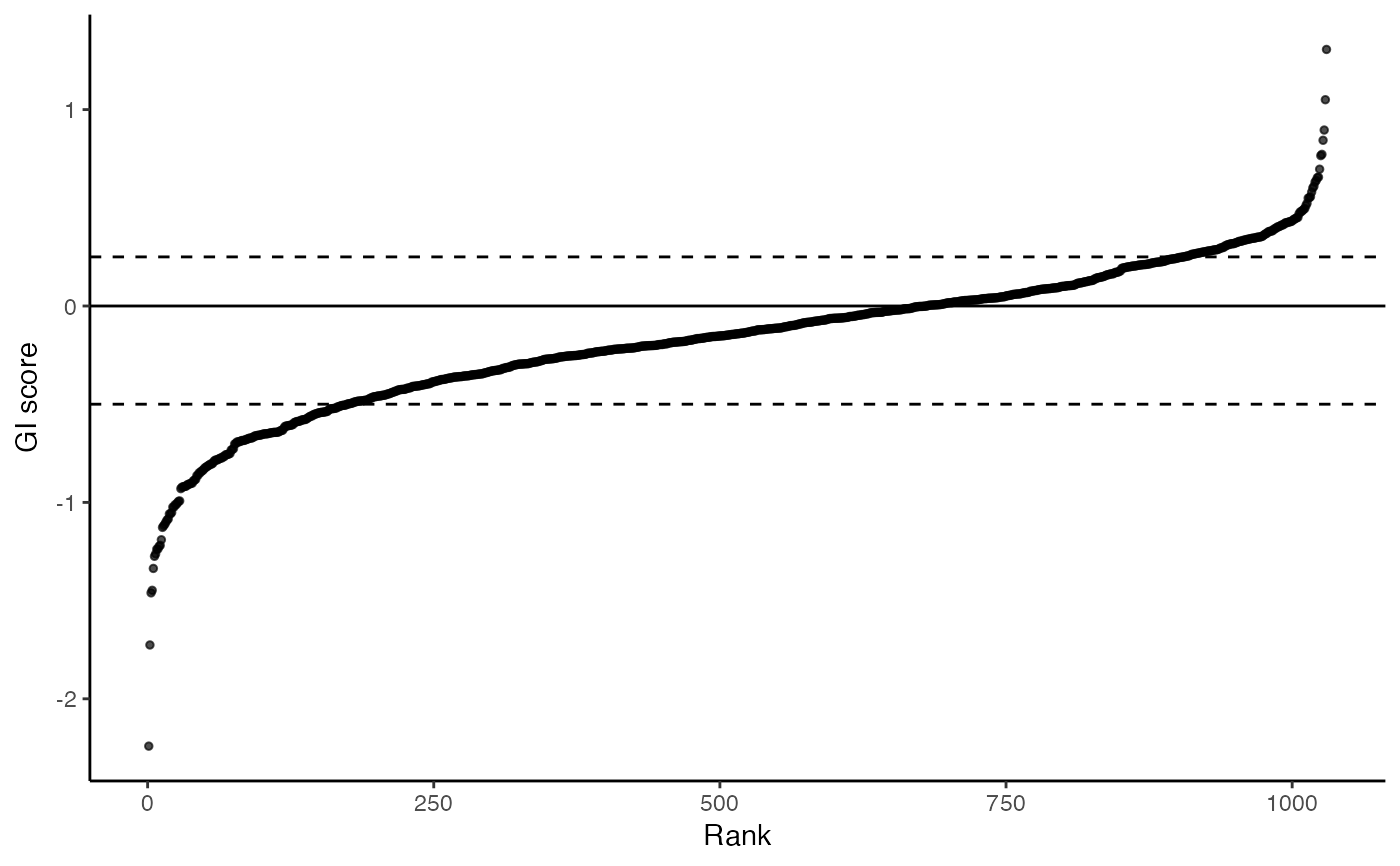
This plot is meant to be functionally equivalent to Fig 5a (for HeLa, equivalent of Fig 3c for PC9). Rank plot of target-level GI scores. Dashed horizontal lines are for GI scores of 0.25 and -0.5
plot_rank_scatter(gimap_dataset, reps_to_drop = "")Arguments
Value
A ggplot2 rankplot of the target level genetic interaction scores.
Examples
# \donttest{
gimap_dataset <- get_example_data("gimap") %>%
gimap_filter() %>%
gimap_annotate(cell_line = "HELA") %>%
gimap_normalize(
timepoints = "day"
) %>%
calc_gi()
#> Annotating Data
#>
Downloading: 3.4 kB
Downloading: 3.4 kB
Downloading: 3.4 kB
Downloading: 3.4 kB
#> Downloading: Achilles_common_essentials.csv
#>
|
| | 0%
|
|======================================================================| 100%
#>
|
| | 0%
|
|=============================================== | 67%
|
|======================================================================| 100%
#> Normalizing Log Fold Change
#> Calculating Genetic Interaction scores
# To plot results
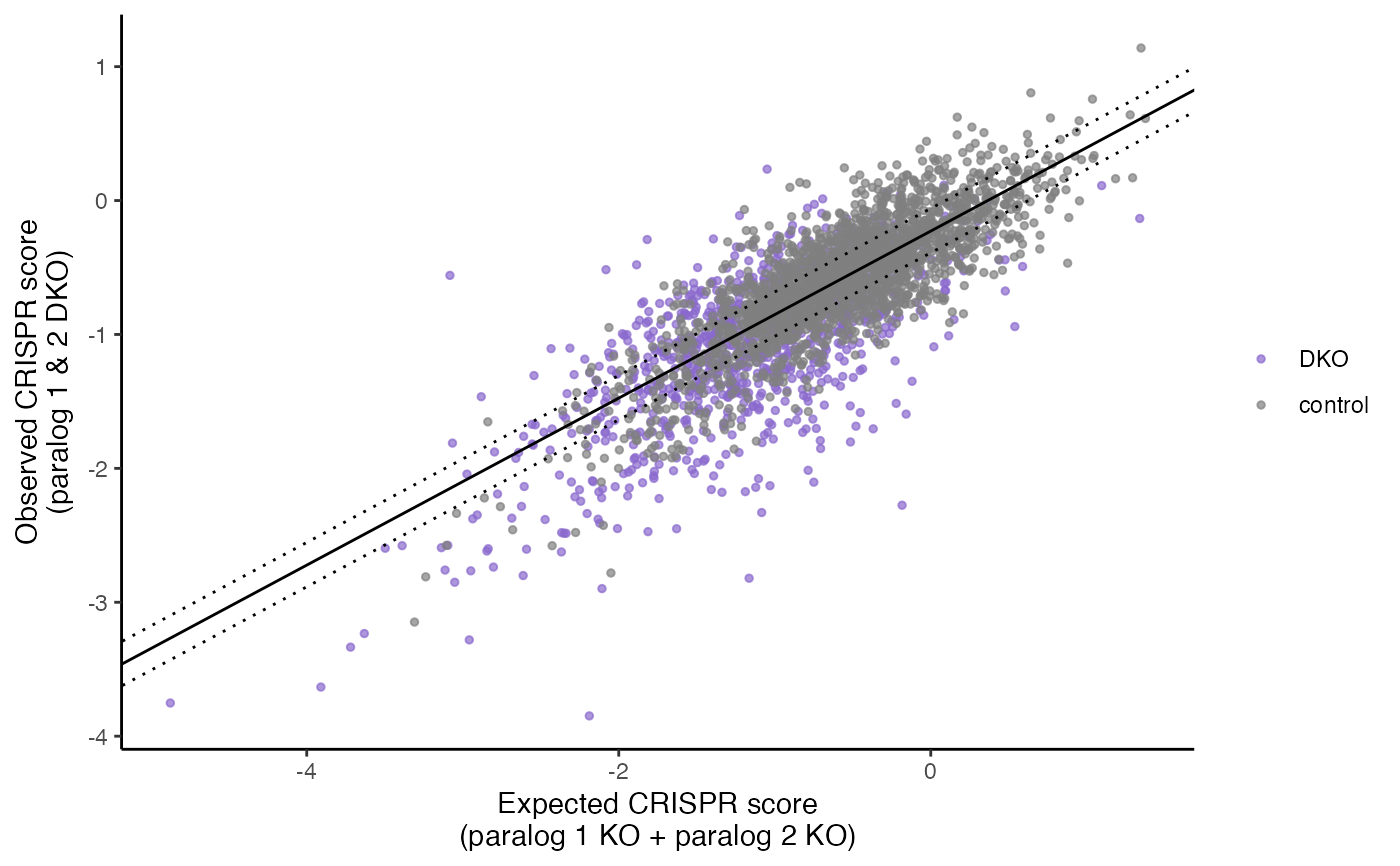
plot_exp_v_obs_scatter(gimap_dataset)
 plot_rank_scatter(gimap_dataset)
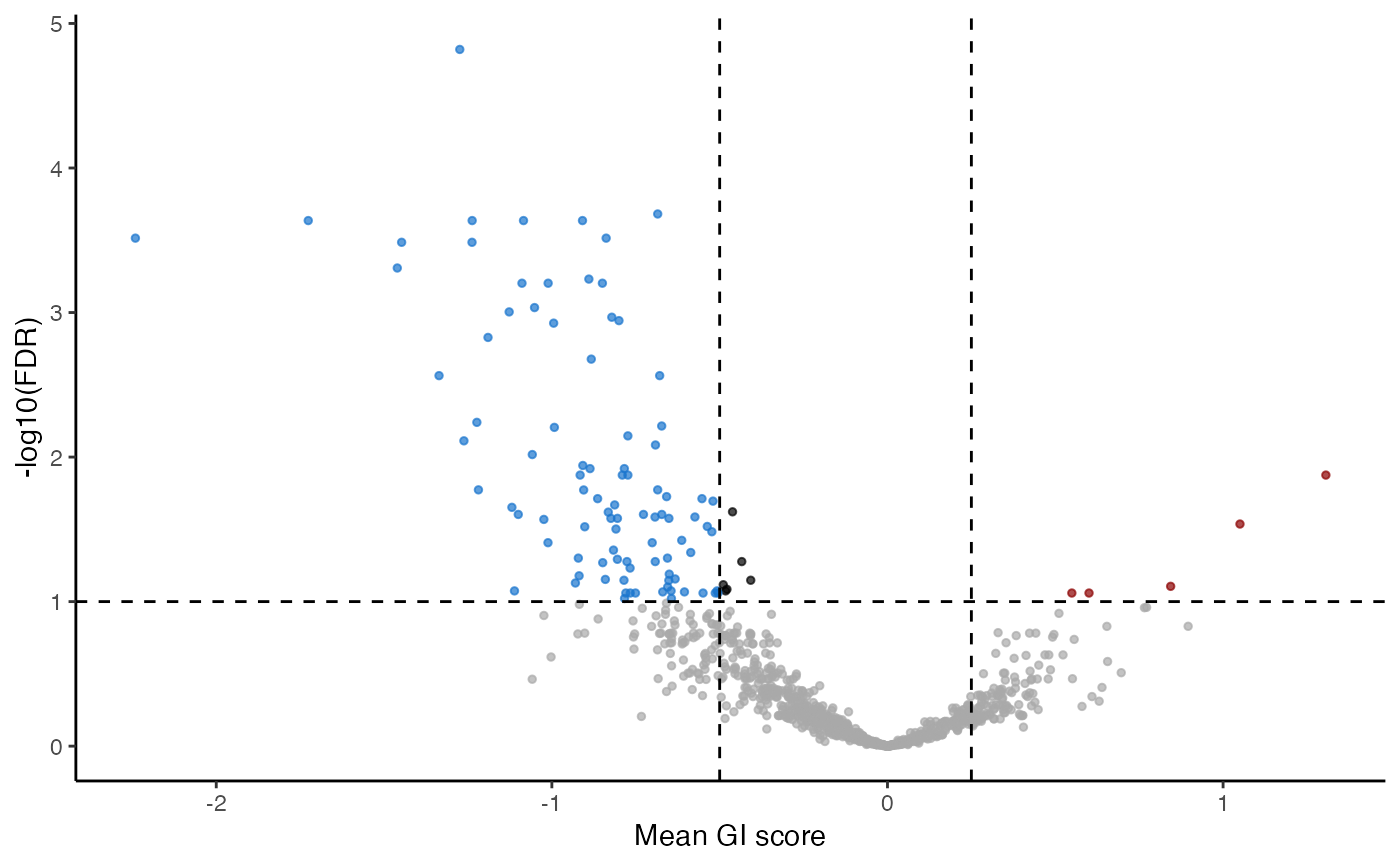
 plot_volcano(gimap_dataset)
 # }
# }