Chapter 4 DUXC and Dux transcriptome compared to that of FSHD
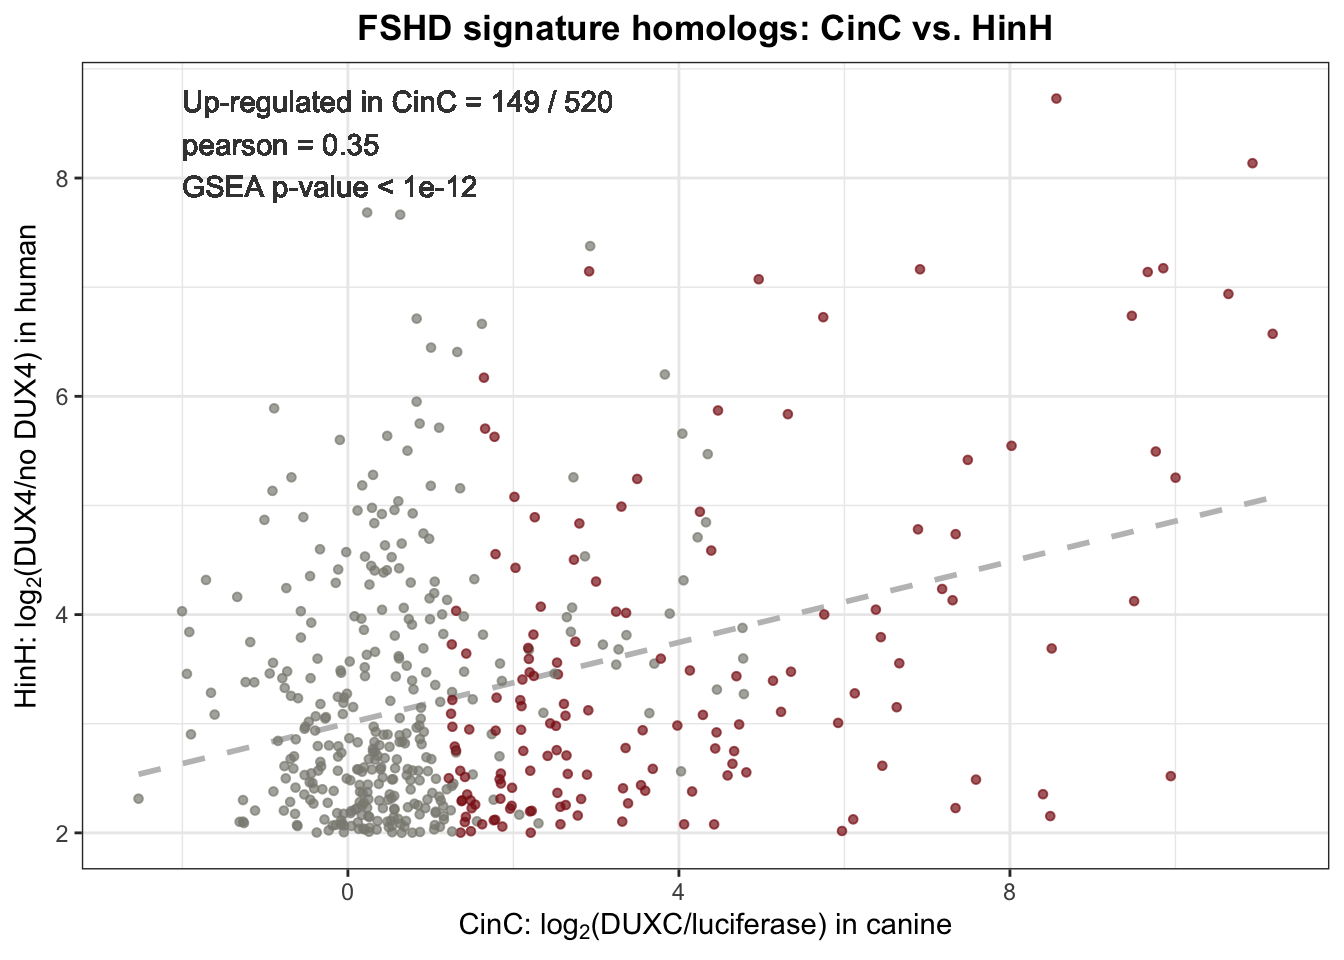
We used a gene set enrichment method to exam whether the FSHD profile was enriched by DUXC transcriptome in the canine model. The results suggested that DUXC induced transcription program similar to FSHD muscle cells. We employed the FSHD transcriptome profile discovered by Jagannathan et al. (Sujatha Jagannathan and Tapscott 2016) - there were 666 mis-expressed genes in FSHD muscle cell lines. Out of 666, 520 have human-canine paired homologous (by Ensembl orthologs database V88); we used hypergeometric tests to exam whether the FSHD transcription program is enriched in canine.
Results. Based on the 520 human-to-canine homologous, the Pearson correlation between DUXC transcriptome and FSHD transcriptome is 0.35, moderately higher than that of between mouse Dux and FSHD transcriptome (0.29). Out of the 520 homologous, 146 (29%) were positively affected by DUXC in canine; the hypergeometric test yielded \(1e-12\) \(p\)-value, suggesting that that the mis-expressed gene set of FSHD was enriched.
Below are the codes implementing the statistics methods.
Load datasets
pkg_dir <- "~/CompBio/canFam3.DuxFamily"
fig_dir <- file.path(pkg_dir, "figures")
data_dir <- file.path(pkg_dir, "data")
pkg_dir <- "~/CompBio/canFam3.DuxFamily"
source(file.path(pkg_dir, "scripts", "load_lib_dataset.R"))
load(file.path(pkg_dir, "data", "canine_human_mouse_ensOrtholog.rda"))
load(file.path(pkg_dir, "data", "human_mouse_ensOrtholog.rda"))
suppressPackageStartupMessages(library(ggplot2))
suppressPackageStartupMessages(library(latex2exp))
4.1 DUXC transcriptome compared to that of FSHD
4.1.1 Get canine-human homologs
# read the table made by Jagannathan 2016
HinH_de <- read_csv(file=file.path(pkg_dir, "extdata",
                                   "Jagannathan-2016-sup-table-1-lfc.csv"), skip = 2) %>%
  dplyr::filter(iDUX4_logFC > 2, iDUX4_pval < 0.05) %>%
  dplyr::select(ENSEMBL, iDUX4_logFC, iDUX4_pval) %>%
  rename(HUMAN_ENSEMBL=ENSEMBL, HinH_logFC=iDUX4_logFC, HinH_padj=iDUX4_pval)

# create canine-to-human ortholog data.frame, restrict to hDUX4 transcriptome (FSHD profile)
canine_human_homolog <- canine_human_mouse_ensOrtholog %>%
  dplyr::select(ensembl_gene_id, hsapiens_homolog_ensembl_gene, hsapiens_homolog_associated_gene_name) %>%
  rename(CANINE_ENSEMBL=ensembl_gene_id, HUMAN_ENSEMBL=hsapiens_homolog_ensembl_gene) %>% # filter out empty string
  dplyr::filter(HUMAN_ENSEMBL != "", !duplicated(HUMAN_ENSEMBL), !duplicated(CANINE_ENSEMBL)) %>%
  inner_join(HinH_de, by="HUMAN_ENSEMBL") %>%
  left_join(CinC, by="CANINE_ENSEMBL") %>%
  left_join(HinC, by="CANINE_ENSEMBL") %>%
  dplyr::mutate(CinC_up = ifelse(CinC_padj < 0.05 & CinC_logFC > 0, "YES", "NO")) %>%
  dplyr::mutate(HinC_up = ifelse(HinC_padj < 0.05 & HinC_logFC > 0, "YES", "NO"))
4.1.2 GSEA: enrichment of FSHD transcriptome
Code below calculates the correlation (Pearson) and implements GSEA inferring FSHD transcriptome enrichment.
# GSEA: universe=; selected=; FSHD set=1735; picked=363;
white_drawn = sum(canine_human_homolog$CinC_up=="YES", na.rm=TRUE) # up-regulated in FSHD profile
white_ball  = CinC %>% dplyr::filter(CinC_logFC > 0, CinC_padj < 0.05) %>% nrow() # up-regulated
black_ball  = nrow(CinC) - white_ball # universe - up-regulated
ball_drawn  = nrow(canine_human_homolog)  # how many are in FSHD profile
prob <- dhyper(x=white_drawn,
               m=white_ball, n=black_ball, k=ball_drawn, log = FALSE)
# correlation: pearson
pearson <- canine_human_homolog %>%
  dplyr::filter(!is.na(CinC_logFC)) %>% summarise(pearson = cor(HinH_logFC, CinC_logFC))
label <- sprintf("Up-regulated in CinC = %2.0f / %1.0f \npearson = %0.2f \nGSEA p-value < 1e-12",
                 sum(canine_human_homolog$CinC_up=="YES", na.rm=TRUE), nrow(canine_human_homolog), pearson)

ggplot(canine_human_homolog, aes(x=CinC_logFC, y=HinH_logFC, color=CinC_up)) +
  #geom_abline(intercept=0, slope=1, color="gray75", alpha=0.2) +
  geom_smooth(method = "lm", se=FALSE, color="gray75", linetype="dashed") +
  geom_point(alpha=0.7, size=1.2) +
  geom_text(x=-2, y=8.8, label=label, hjust=0, vjust=1, color="gray25") +
  theme_bw() +
  theme(legend.position="none") +
  scale_color_manual(values=c("ivory4", "firebrick4")) +
  labs(title="FSHD signature homologs: CinC vs. HinH",
       y=TeX("HinH: $\\log_2$(DUX4/no DUX4) in human"),
       x=TeX("CinC: $\\log_2$(DUXC/luciferase) in canine")) +
  theme(plot.title = element_text(hjust = 0.5, face="bold"))
## Warning: Removed 35 rows containing non-finite values (stat_smooth).## Warning: Removed 35 rows containing missing values (geom_point).
Figure 4.1: Scatter plot of 520 homologs expression in DUXC expressed canine myobrast and FSHD muscle cells. Dashlines represents the linear regression.
ggsave(filename=file.path(pkg_dir, "figures",
                          "HinH_CinC_FSHD_signature_homologs.pdf"),
       width=5, height=3.75)
## Warning: Removed 35 rows containing non-finite values (stat_smooth).
## Warning: Removed 35 rows containing missing values (geom_point).4.2 Dux transcriptome compared to that of FSHD
4.2.1 Get canine-human homologs
human_mouse_homolog <- human_mouse_ensOrtholog %>%
  dplyr::select(ensembl_gene_id, external_gene_name,
                mmusculus_homolog_ensembl_gene, mmusculus_homolog_associated_gene_name) %>%
  rename(HUMAN_ENSEMBL=ensembl_gene_id, HUMAN_gene_name=external_gene_name ,
         MOUSE_ENSEMBL=mmusculus_homolog_ensembl_gene,
         MOUSE_gene_name=mmusculus_homolog_associated_gene_name) %>%
  dplyr::filter(HUMAN_ENSEMBL != "", !duplicated(HUMAN_ENSEMBL), !duplicated(MOUSE_ENSEMBL)) %>%
  inner_join(HinH_de, by="HUMAN_ENSEMBL") %>%
  left_join(MinM, by="MOUSE_ENSEMBL") %>%
  left_join(HinM, by="MOUSE_ENSEMBL") %>%
  dplyr::mutate(MinM_up = ifelse(MinM_padj < 0.05 & MinM_logFC > 0, "YES", "NO")) %>%
  dplyr::mutate(HinM_up = ifelse(HinM_padj < 0.05 & HinM_logFC > 0, "YES", "NO"))
4.2.2 GSEA: enrichment of FSHD transcriptome
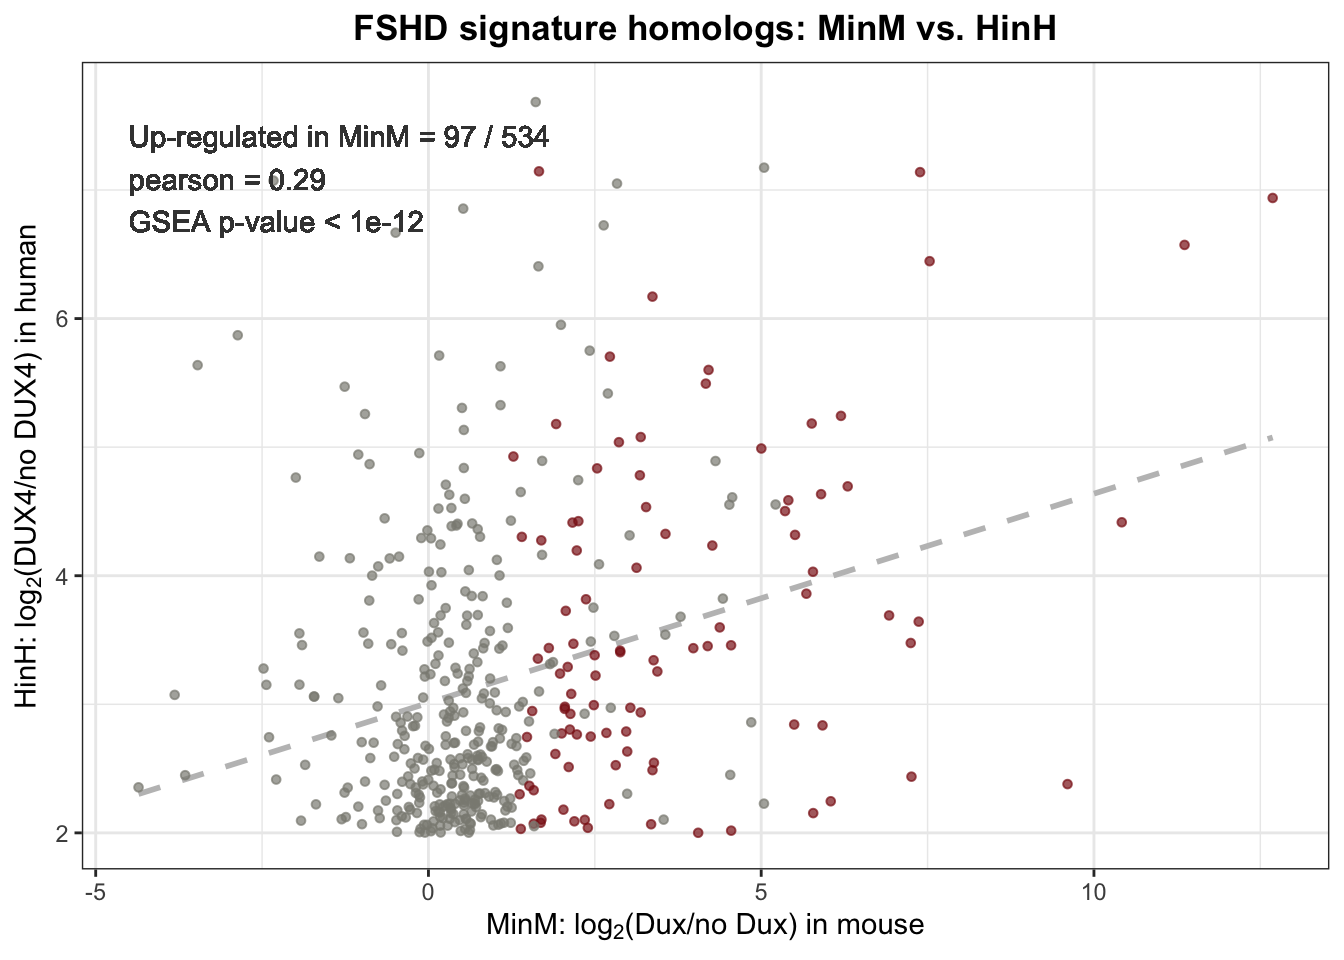
Out of 666 mis-expressed genes in FSHD muscle cells, 543 has homologs in mouse; 97 out of 534 homologs were up-regulated in Dux expressed mouse cell line. The correlation of 534 homologs expression between Dux expressed mouse cell line and FSHD muscle cells is 0.29. The GSEA by hypergeometric test gave \(p\)-value < \(1e-12\) suggesting that Dux also induced similar transcription activity similar to FSHD muscle cells.
# GSEA
white_drawn = sum(human_mouse_homolog$MinM_up=="YES", na.rm=TRUE) # up-regulated in FSHD profile
white_ball  = MinM %>% dplyr::filter(MinM_logFC > 0, MinM_padj < 0.05) %>% nrow() # up-regulated
black_ball  = nrow(MinM) - white_ball # universe - up-regulated
ball_drawn  = nrow(human_mouse_homolog)  # how many are in FSHD profile
prob <- dhyper(x=white_drawn,
               m=white_ball, n=black_ball, k=ball_drawn, log = FALSE)
# correlation: pearson
pearson <- human_mouse_homolog %>%
  dplyr::filter(!is.na(MinM_logFC)) %>% summarise(pearson = cor(HinH_logFC, MinM_logFC))
label <- sprintf("Up-regulated in MinM = %2.0f / %1.0f \npearson = %0.2f \nGSEA p-value < 1e-12",
                 sum(human_mouse_homolog$MinM_up=="YES", na.rm=TRUE), nrow(human_mouse_homolog), pearson)

ggplot(human_mouse_homolog, aes(x=MinM_logFC, y=HinH_logFC, color=MinM_up)) +
  #geom_abline(intercept=0, slope=1, color="gray75", alpha=0.2) +
  geom_smooth(method = "lm", se=FALSE, color="gray75", linetype="dashed") +
  geom_point(alpha=0.7, size=1.2) +
  geom_text(x=-4.5, y=7.5, label=label, hjust=0, vjust=1,
            aes(fontface="plain"), color="gray25") +
  theme_bw() +
  theme(legend.position="none") +
  scale_color_manual(values=c("ivory4", "firebrick4")) +
  labs(title="FSHD signature homologs: MinM vs. HinH",
       y=TeX("HinH: $\\log_2$(DUX4/no DUX4) in human"),
       x=TeX("MinM: $\\log_2$(Dux/no Dux) in mouse")) +
  theme(plot.title = element_text(hjust = 0.5, face="bold"))
## Warning: Removed 75 rows containing non-finite values (stat_smooth).## Warning: Removed 91 rows containing missing values (geom_point).
Figure 4.2: Scatter plot of 534 homologs expression in Dux expressed mouse myobrast and FSHD muscle cells. Dashlines represents the linear regression.
ggsave(filename=file.path(pkg_dir, "figures",
                          "HinH_MinM_FSHD_signature_homologs.pdf"),
       width=5, height=3.75)
## Warning: Removed 75 rows containing non-finite values (stat_smooth).
## Warning: Removed 91 rows containing missing values (geom_point).# References
Sujatha Jagannathan, Rebecca Resnick, Sean C. Shadle, and Stephen J. Tapscott. 2016. “Model Systems of Dux4 Expression Recapitulate the Transcriptional Profile of Fshd Cells.” Human Molecular Genetics. https://doi.org/doi: 10.1093/hmg/ddw271.