Chapter 1 ChIP-seq for the canine model
We performed ChIP-seq experiments to determind the transcription factor DUX4, DUXC and DUXC-ALT’s binding sites and motifs in the canine genome. DUX4 and DUXC were using monoclonal antiboy whereas DUXC-ALT using polyclonol Below we described the sample information and ChIP-seq preprocessing pipeline, peaks calling, and motifs discovery.
suppressPackageStartupMessages(library(TxDb.Cfamiliaris.UCSC.canFam3.ensGene))
txdb <- TxDb.Cfamiliaris.UCSC.canFam3.ensGene
suppressPackageStartupMessages(library(canFam3.rmsk))
suppressPackageStartupMessages(library(tidyverse))
suppressPackageStartupMessages(library(wesanderson))
suppressPackageStartupMessages(library(ggVennDiagram))
# eventially change to loading from github
pkg_dir <- "~/CompBio/canFam3.DuxFamily"
load(file.path(pkg_dir, "data", "peaks_list.rda")) # peaks list
load(file.path(pkg_dir, "data", "chipseq_si.rda")) # sample information
1.1 ChIP-seq samples
##                  sample_name lib_size transcription_factor  cell_type
## 1   Sample1_ImmCnMb_luc_poly 16561563            luciferas polyclonal
## 2 Sample4_ImmCnMb_CALTh_poly 17995356             DUXC-ALT polyclonal
## 3   Sample5_ImmCnMb_luc_mono 14149968            luciferas monoclonal
## 4 Sample6_ImmCnMb_hDUX4_mono 15326657                 DUX4 monoclonal
## 5   Sample7_ImmCnMb_CCH_mono 15316644                 DUXC monoclonal
1.2 Analysis workflow
We used starndard pre-processing pipeline and MACS2 to call peaks
- Filter unqualified reads: based on casava filter, filtered out reads whose filter flag, indicated in the identifier, equals to “Y”.
- Trim adapter:
AGATCGGAAGAGCACACGTCAGAACTCCAGTCACGCACTAATCTCGTATG
- Quality control: quality control by fastqc to confirm that there is no more adapter contemination
- Alignement: align read to the canFam3 genome build by BWA-0.7.10 (
/scripts/do_bwa.sh) - Peak calling: peak calling made by macs2 (MACS2) with Luciferase monoclonal samples as negative controls; monoclonal cell line
Sample5_ImmCnMb_luc_monois used for monoclonal DUXC/DUX4 samples and the polyclonal cell lineSample1_ImmCnMb_luc_polyforSample4_ImmCnMb_CALTh_poly)
macs2 callpeak -t $sampleName.bam -c $cnt -f BAM \
  --outdir $macsDir -g 2.42e9 -n $sampleName \
-B -q 0.01- Peak annotation: annotate peaks using Bioconductor ChIPseeker (Yu, Wang, and He 2015) package along with a customed
TxDb(TxDb.Cfamiliaris.UCSC.canFam3.ensGene) annotation package derived from the Ensembl’s gtf file in the canfam3 genome build.
- Motif discovery: prepare peaks FASTA files by selecting top 1000 peaks and flank up/downstream 50 bps around the peak summits (
/scripts/peaks.R); discovery motifs by using MEME 5.1.1 (/scripts/peaks.R)
meme Sample6_ImmCnMb_hDUX4_mono_peaksSeq_100.fa \
  -dna -oc . -nostatus -time 18000 -mod zoops \
  -nmotifs 3 -minw 6 -maxw 11 -objfun classic \
  -revcomp -markov_order 0
1.3 Peaks and functional distribution
The peaks file is located at ../data/peaks_list.rda: It is a list of GRanges instances containing peaks coordinates, summits, q-values, annotaion, overlapping staus with repeat elements, and orthologs. For example:
## GRanges object with 6031 ranges and 24 metadata columns:
##          seqnames              ranges strand |    length abs_summit    pileup
##             <Rle>           <IRanges>  <Rle> | <integer>  <integer> <numeric>
##      [1]     chr1             285-544      * |       260        519       135
##      [2]     chr1           2696-3055      * |       360       2847       244
##      [3]     chr1           4078-4790      * |       713       4602       367
##      [4]     chr1           5785-6158      * |       374       6004       385
##      [5]     chr1           6764-7193      * |       430       6946       473
##      ...      ...                 ...    ... .       ...        ...       ...
##   [6027]     chrX 122767363-122767625      * |       263  122767497        12
##   [6028]     chrX 122902787-122903048      * |       262  122902820        13
##   [6029]     chrX 123168859-123169208      * |       350  123169031        14
##   [6030]     chrX 123213575-123213866      * |       292  123213776        13
##   [6031]     chrX 123686002-123686277      * |       276  123686087        13
##          X.log10.pvalue. fold_enrichment X.log10.qvalue.
##                <numeric>       <numeric>       <numeric>
##      [1]         7.04597         1.60741         3.91784
##      [2]         7.02327          1.4164         3.89587
##      [3]         6.33763         1.30306         3.33661
##      [4]         7.20888         1.32224         4.06735
##      [5]        14.09717         1.45134        10.16508
##      ...             ...             ...             ...
##   [6027]         9.90244         6.31739         6.41459
##   [6028]          9.6226         5.93351         6.15395
##   [6029]         9.94595         5.91592         6.45397
##   [6030]        11.11847         6.86022         7.49343
##   [6031]         7.43072         4.60644         4.26318
##                                        name
##                                 <character>
##      [1]    Sample7_ImmCnMb_CCH_mono_peak_1
##      [2]    Sample7_ImmCnMb_CCH_mono_peak_2
##      [3]    Sample7_ImmCnMb_CCH_mono_peak_3
##      [4]    Sample7_ImmCnMb_CCH_mono_peak_4
##      [5]    Sample7_ImmCnMb_CCH_mono_peak_5
##      ...                                ...
##   [6027] Sample7_ImmCnMb_CCH_mono_peak_6027
##   [6028] Sample7_ImmCnMb_CCH_mono_peak_6028
##   [6029] Sample7_ImmCnMb_CCH_mono_peak_6029
##   [6030] Sample7_ImmCnMb_CCH_mono_peak_6030
##   [6031] Sample7_ImmCnMb_CCH_mono_peak_6031
##                                                                   annotation
##                                                                  <character>
##      [1]                                                   Distal Intergenic
##      [2]                                                   Distal Intergenic
##      [3]                                                   Distal Intergenic
##      [4]                                                   Distal Intergenic
##      [5]                                                   Distal Intergenic
##      ...                                                                 ...
##   [6027]   Intron (ENSCAFT00000044495.2/ENSCAFG00000019613.4, intron 1 of 6)
##   [6028] Intron (ENSCAFT00000031203.3/ENSCAFG00000019631.3, intron 25 of 25)
##   [6029]  Intron (ENSCAFT00000031213.3/ENSCAFG00000019638.3, intron 6 of 15)
##   [6030]                                                    Promoter (2-3kb)
##   [6031]                                                   Distal Intergenic
##              geneChr   geneStart     geneEnd  geneLength  geneStrand
##          <character> <character> <character> <character> <character>
##      [1]           1      270005      275409        5405           1
##      [2]           1      270005      275409        5405           1
##      [3]           1      270005      275409        5405           1
##      [4]           1      270005      275409        5405           1
##      [5]           1      270005      275409        5405           1
##      ...         ...         ...         ...         ...         ...
##   [6027]          39   122556508   122779142      222635           2
##   [6028]          39   122912936   122913286         351           1
##   [6029]          39   123162497   123205171       42675           1
##   [6030]          39   123211029   123230857       19829           1
##   [6031]          39   123695785   123707849       12065           2
##                        geneId         transcriptId distanceToTSS overlap.LTR
##                   <character>          <character>   <character>   <logical>
##      [1] ENSCAFG00000030108.1 ENSCAFT00000043967.1       -269461       FALSE
##      [2] ENSCAFG00000030108.1 ENSCAFT00000043967.1       -266950       FALSE
##      [3] ENSCAFG00000030108.1 ENSCAFT00000043967.1       -265215       FALSE
##      [4] ENSCAFG00000030108.1 ENSCAFT00000043967.1       -263847       FALSE
##      [5] ENSCAFG00000030108.1 ENSCAFT00000043967.1       -262812       FALSE
##      ...                  ...                  ...           ...         ...
##   [6027] ENSCAFG00000019613.4 ENSCAFT00000044495.2         11517       FALSE
##   [6028] ENSCAFG00000031844.1 ENSCAFT00000037773.2         -9888       FALSE
##   [6029] ENSCAFG00000019638.3 ENSCAFT00000031213.3          6362       FALSE
##   [6030] ENSCAFG00000019639.3 ENSCAFT00000031215.3          2546       FALSE
##   [6031] ENSCAFG00000033806.1 ENSCAFT00000054225.1         21572       FALSE
##                            repRange     repName    repClass   repFamily
##                         <character> <character> <character> <character>
##      [1]           chr1:100-11597:-          Bs   Satellite   Satellite
##      [2]           chr1:100-11597:-          Bs   Satellite   Satellite
##      [3]           chr1:100-11597:-          Bs   Satellite   Satellite
##      [4]           chr1:100-11597:-          Bs   Satellite   Satellite
##      [5]           chr1:100-11597:-          Bs   Satellite   Satellite
##      ...                        ...         ...         ...         ...
##   [6027] chrX:122767214-122767812:+   L1_Canid_        LINE          L1
##   [6028] chrX:122902887-122903062:-       L1MEd        LINE          L1
##   [6029] chrX:123169121-123169286:+    SINEC_a1        SINE    tRNA-Lys
##   [6030] chrX:123213504-123213705:-        L1M5        LINE          L1
##   [6031] chrX:123685809-123686326:-   L1_Canis1        LINE          L1
##          external_gene_name hsapiens_homolog_associated_gene_name
##                 <character>                           <character>
##      [1]                                               AP002962.1
##      [2]                                               AP002962.1
##      [3]                                               AP002962.1
##      [4]                                               AP002962.1
##      [5]                                               AP002962.1
##      ...                ...                                   ...
##   [6027]               GAB3                                  GAB3
##   [6028]                                                   H2AFB1
##   [6029]
##   [6030]               VBP1                                  VBP1
##   [6031]
##          mmusculus_homolog_associated_gene_name
##                                     <character>
##      [1]
##      [2]
##      [3]
##      [4]
##      [5]
##      ...                                    ...
##   [6027]                                   Gab3
##   [6028]                                 H2afb2
##   [6029]
##   [6030]                                   Vbp1
##   [6031]
##   -------
##   seqinfo: 40 sequences from an unspecified genome; no seqlengths
1.3.1 Number of peaks
n_peaks <- t(map_dfr(peaks_list, length)) %>% as.data.frame() %>%
  rownames_to_column(var="sample_name") %>%
  dplyr::rename(num_peaks=V1) %>%
  add_column(transcription_factor = c("DUX4", "DUXC", "DUXC_ALT",
                                       "DUX4", "DUXC"))
n_peaks[c(5, 4, 3), ]
## sample_name num_peaks transcription_factor
## 5 Sample7_ImmCnMb_CCH_mono 6031 DUXC
## 4 Sample6_ImmCnMb_hDUX4_mono 85825 DUX4
## 3 Sample4_ImmCnMb_CALTh_poly 561 DUXC_ALT1.3.2 Functional discribution
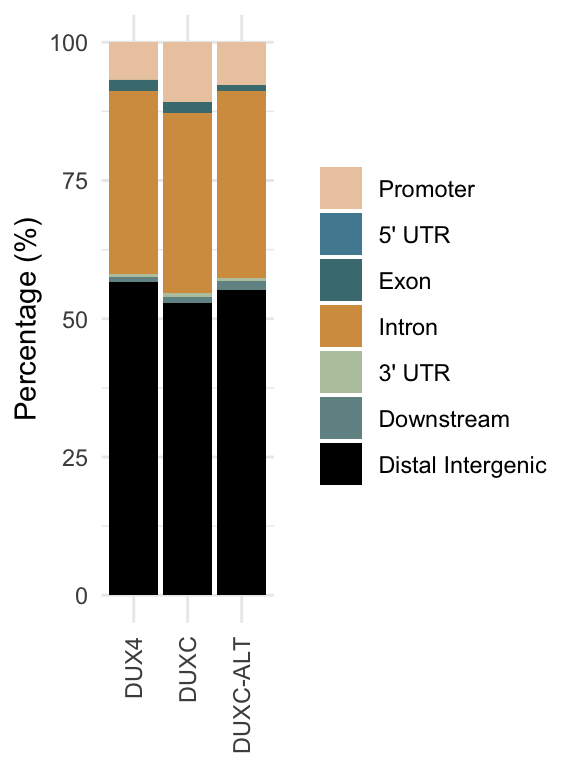
Visualization of the genomic annotation by peaks’ functional location.
.simplify_annotation <- function(peaks_gr) {
  # Promoter, 5' UTR, Exon, Intron, 3' UTR, Distal Intergenic,
  data.frame(detail = peaks_gr$annotation) %>%
    add_column(simplify="unknown") %>%
    dplyr::mutate(simplify = case_when(
      grepl("Promoter", detail) ~ "Promoter",
      grepl("5' UTR", detail) ~ "5' UTR",
      grepl("Exon", detail) ~ "Exon",
      grepl("Intron", detail) ~ "Intron",
      grepl("3' UTR", detail) ~ "3' UTR",
      grepl("Downstream", detail) ~ "Downstream",
      grepl("Distal Intergenic", detail) ~ "Distal Intergenic")
    ) %>%
    dplyr::mutate(simplify=factor(simplify, levels=c("Promoter", "5' UTR",
                                                     "Exon",
                                                     "Intron", "3' UTR",
                                                     "Downstream",
                                                     "Distal Intergenic")))
}
CCH_df <- .simplify_annotation(peaks_list[["Sample7_ImmCnMb_CCH_mono"]]) %>%
count(simplify) %>%
dplyr::mutate(freq=n/sum(n), transcription_factor="DUXC")
hDUX4_df <- .simplify_annotation(peaks_list[["Sample6_ImmCnMb_hDUX4_mono"]]) %>%
count(simplify) %>%
dplyr::mutate(freq=n/sum(n), transcription_factor="DUX4")
CALTH_df <- .simplify_annotation(peaks_list[["Sample4_ImmCnMb_CALTh_poly"]]) %>%
count(simplify) %>%
dplyr::mutate(freq=n/sum(n), transcription_factor="DUXC-ALT")
df <- CCH_df %>% bind_rows(hDUX4_df) %>% bind_rows(CALTH_df) %>%
dplyr::mutate(transcription_factor=factor(transcription_factor,
levels=c("DUX4", "DUXC",
"DUXC-ALT"))) %>%
dplyr::mutate(percentage=freq * 100)
ggplot(df, aes(x=transcription_factor, y=percentage, fill=simplify)) +
geom_bar(stat="identity") +
theme_minimal() +
labs(y="Percentage (%)") +
theme(axis.title.x=element_blank(), legend.title = element_blank(),
axis.text.x = element_text(angle = 90, vjust = 0.5, hjust=1))+
scale_fill_manual(values = wes_palette("Darjeeling2", n=7,
type="continuous"))
Figure 1.1: Functional distribution of peaks.
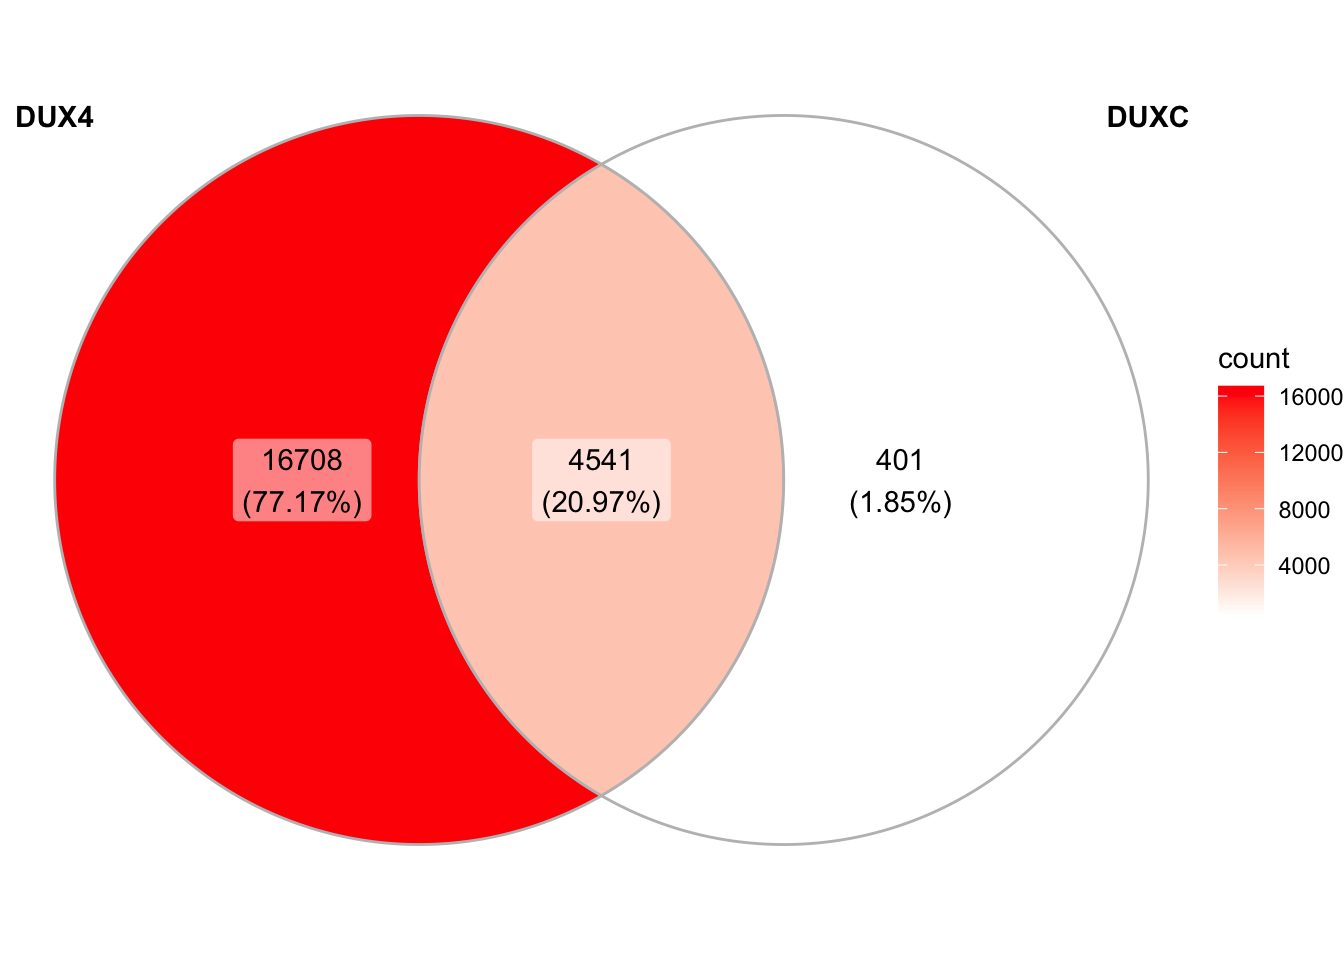
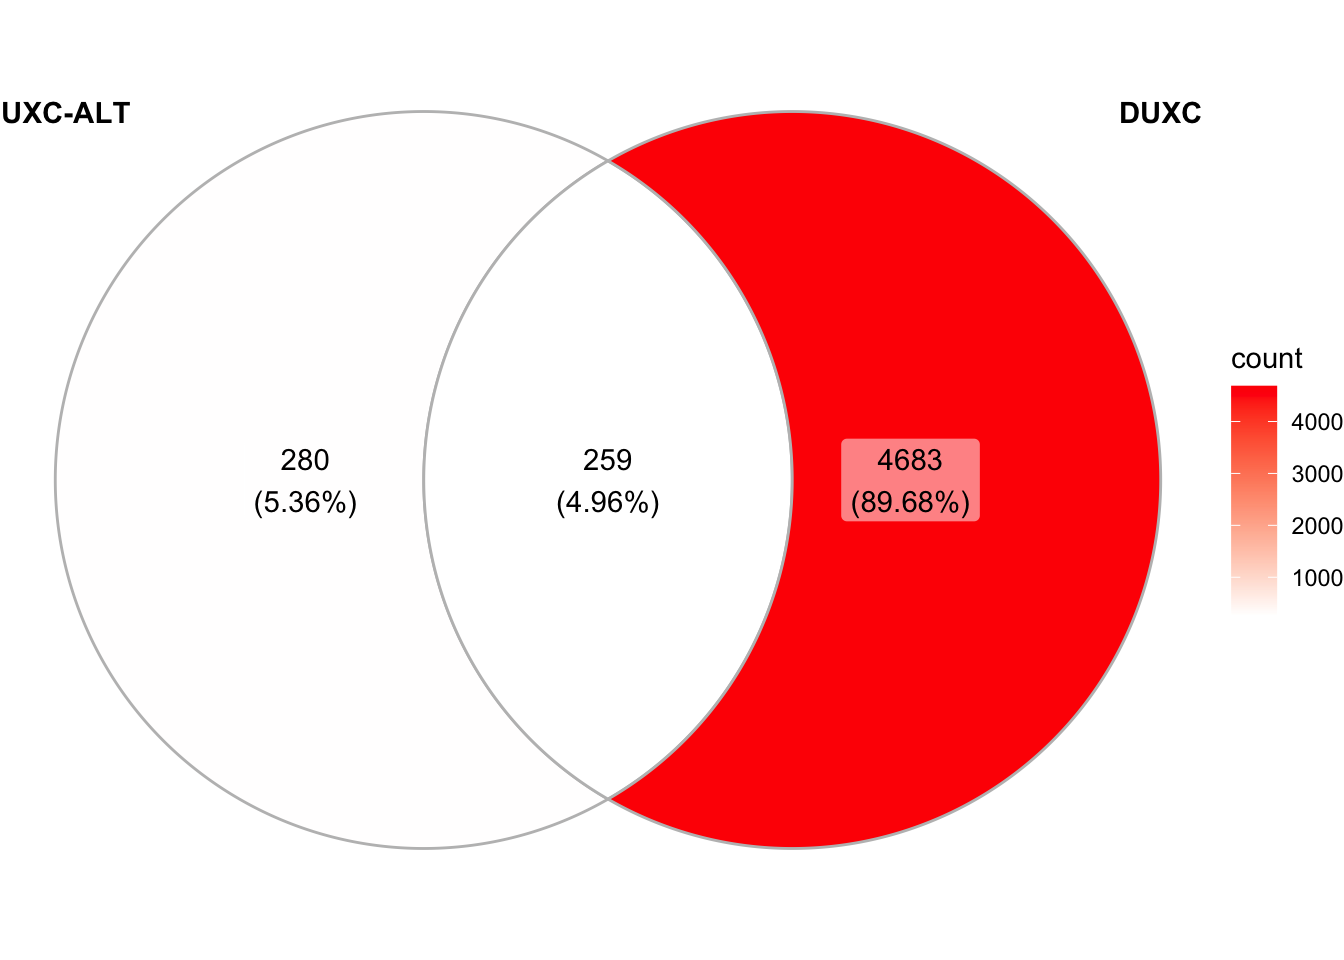
1.4 Overlap of peaks
1.5 Motifs analysis
Quesition: Do DUXC’s A or G peaks overlap with hDUX4 peaks? About 60% and 50% of A-peaks and G-peaks overlap with hDUX4 peaks, respectively.
Question: As for DUXC motif T(A/G)ATCCAATCA, does the position, A/G, associated with induced genes? No, neither A nor G motif is associated with induced genes.
# References
Yu, Guangchuang, Li-Gen Wang, and Qing-Yu He. 2015. “ChIPseeker: An R/Bioconductor Package for Chip Peak Annotation, Comparison and Visualization.” Bioinformatics 31 (14): 2382–3. https://doi.org/10.1093/bioinformatics/btv145.

