Chapter 3 DUXC transcriptome
In this chapter, we present
(1) the hypothesis setting for determining differentailly expressed genes in the canine model
(2) MA plots of DUXC, DUX4 and DUXC-ALT expression in canine
(3) GO analysis for the DUXC-ALT down-regulated genes
(4) analysis for the cross-species models: DUX4 expression in canine and murine
3.1 Load datasets and settings
First, we load the DESeqDataSet instances (container of gene expression matrix and metadata) for all canine, mouse, and human models:
suppressPackageStartupMessages(library(DESeq2))
suppressPackageStartupMessages(library(tidyverse))
suppressPackageStartupMessages(library(ggVennDiagram))
suppressPackageStartupMessages(library(org.Cf.eg.db))
suppressPackageStartupMessages(library(TxDb.Cfamiliaris.UCSC.canFam3.ensGene))
suppressPackageStartupMessages(library(goseq))
suppressPackageStartupMessages(library(latex2exp))
pkg_dir <- "~/CompBio/canFam3.DuxFamily"
data_dir <- file.path(pkg_dir, "data")
fig_dir <- file.path(pkg_dir, "figures")
# load datasets
source(file.path(pkg_dir, "scripts", "tools.R"))
load(file.path(data_dir, "CinC.ens.dds.rda")) # DUXC in canine
load(file.path(data_dir, "CALTinC.ens.dds.rda")) # DUXC-ALT in canine
load(file.path(data_dir, "HinC.ens.dds.rda")) # DUX4 in canine
load(file.path(data_dir, "C2C12.ens.ddsl2.rda")) #DUX4 and Dux in murine

rownames(HinC.ens.dds) <- sapply(strsplit(rownames(HinC.ens.dds), fixed=TRUE, "."), "[", 1)
rownames(CinC.ens.dds) <- sapply(strsplit(rownames(CinC.ens.dds), fixed=TRUE, "."), "[", 1)
rownames(CALTinC.ens.dds) <- sapply(strsplit(rownames(CALTinC.ens.dds), fixed=TRUE, "."), "[", 1)
3.2 DESeq2
3.2.1 hypothesis settings
\(H_0: |log2FoldChange| < 1\) with adjusted p-value threshold \(0.05\).
3.2.2 CinC: DUXC expresison in canine muscle cells
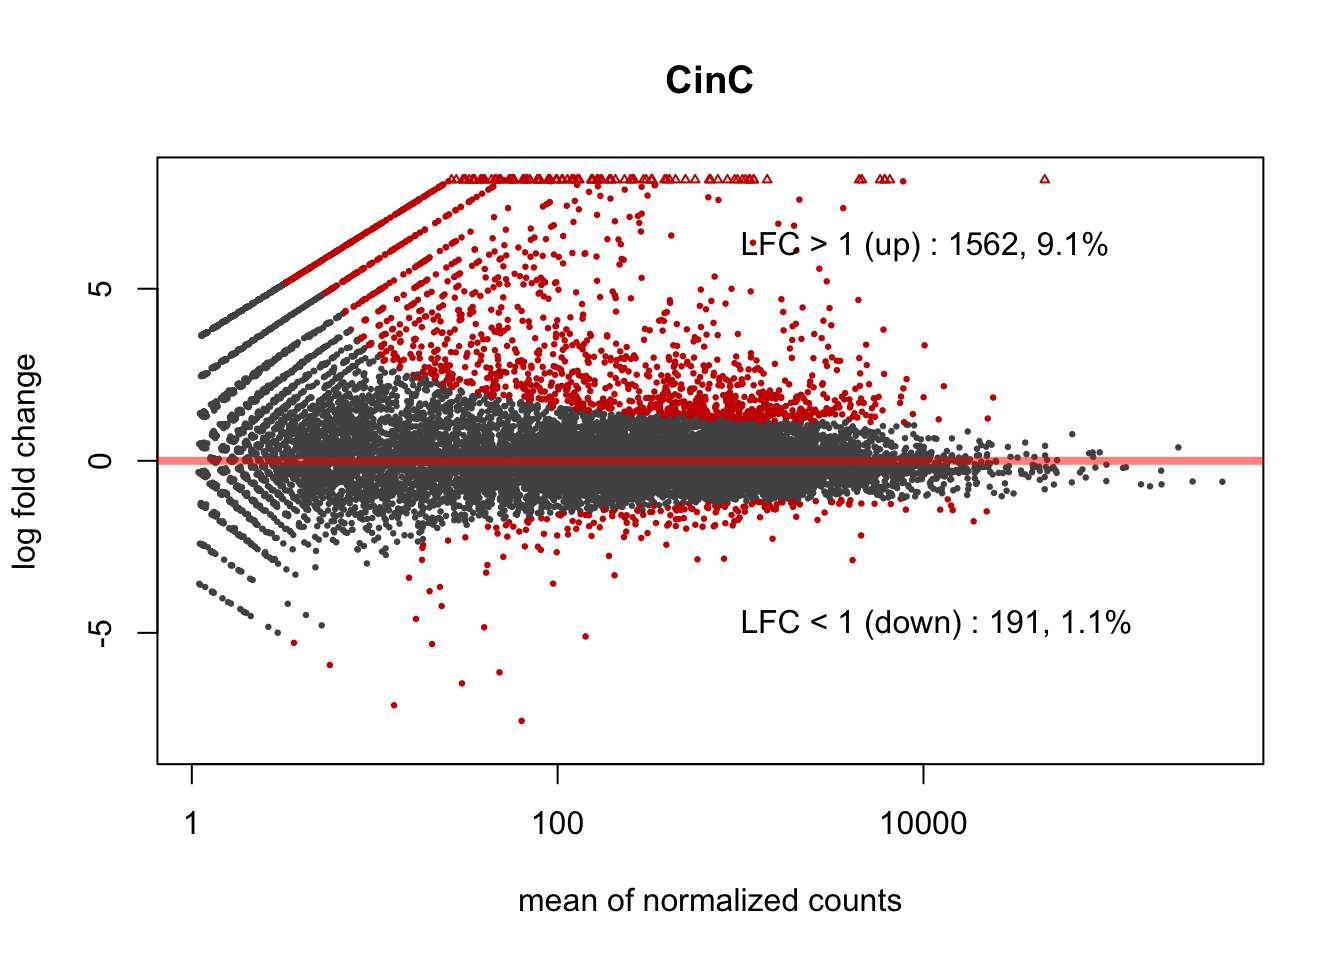
Figure 3.1: MA plot of DUXC expression in canine
3.2.3 HinC: DUX4 expression in canine muscle cells
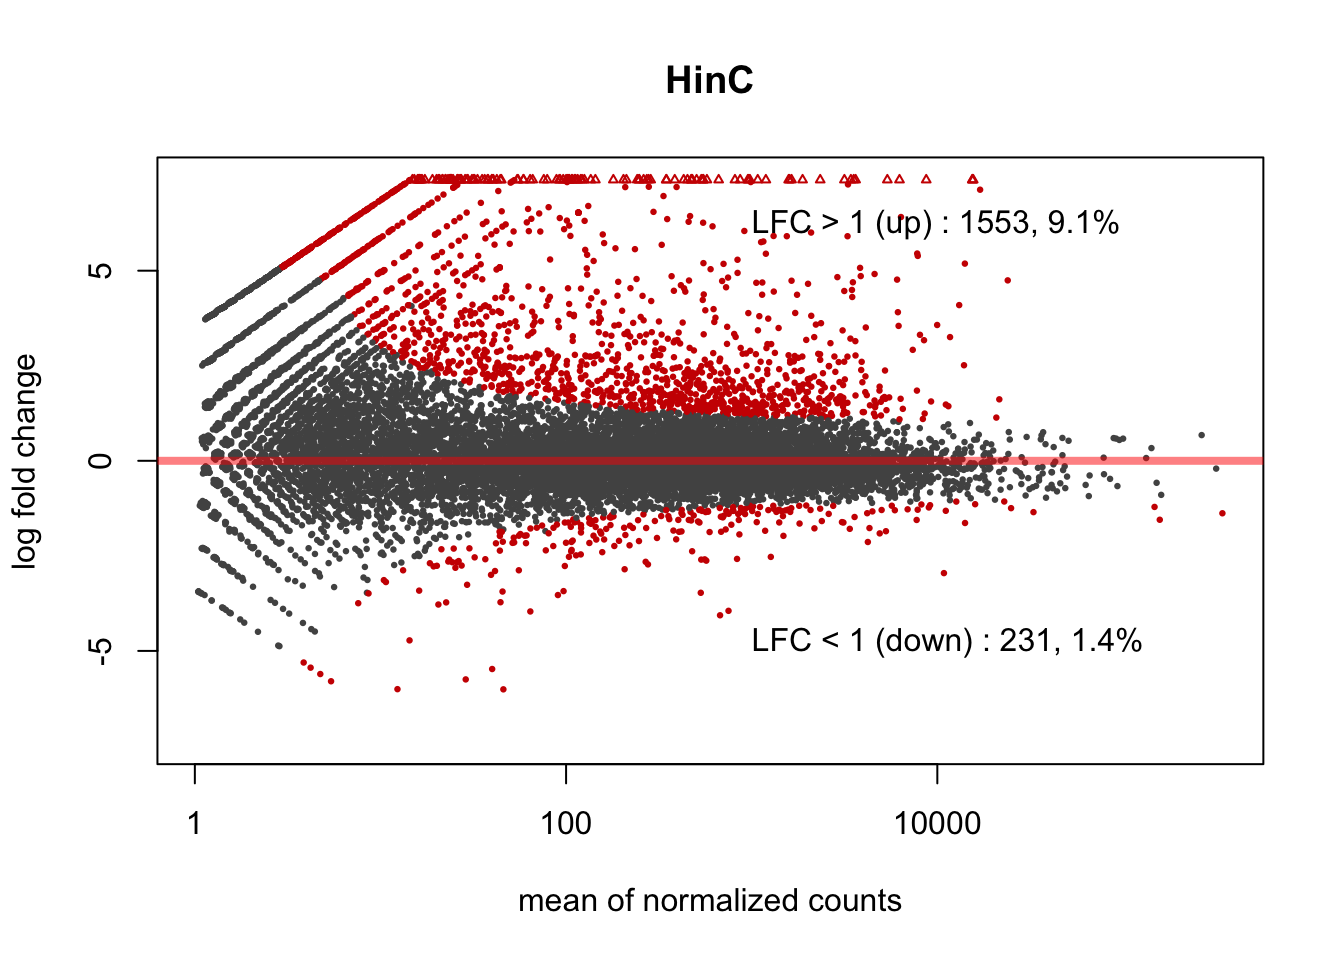
Figure 3.2: MA plot of DUX4 expression in canine
3.2.4 DUXC-ALT expression - CALTinC
DUXC-ALT positively affects a few genes (20) but the down-regulates are similar with the DUXC and DUX4 down-regulates. This suggests that even the in-frame extra exon of DUXC-ALT disrupts the transcriptional activity, the conserved C-terminal get to maintain its function and represses expression of some INF-induced genes (e.g. ISG15, CCL5, CXCL10, RSAD2, MX1/MX2).
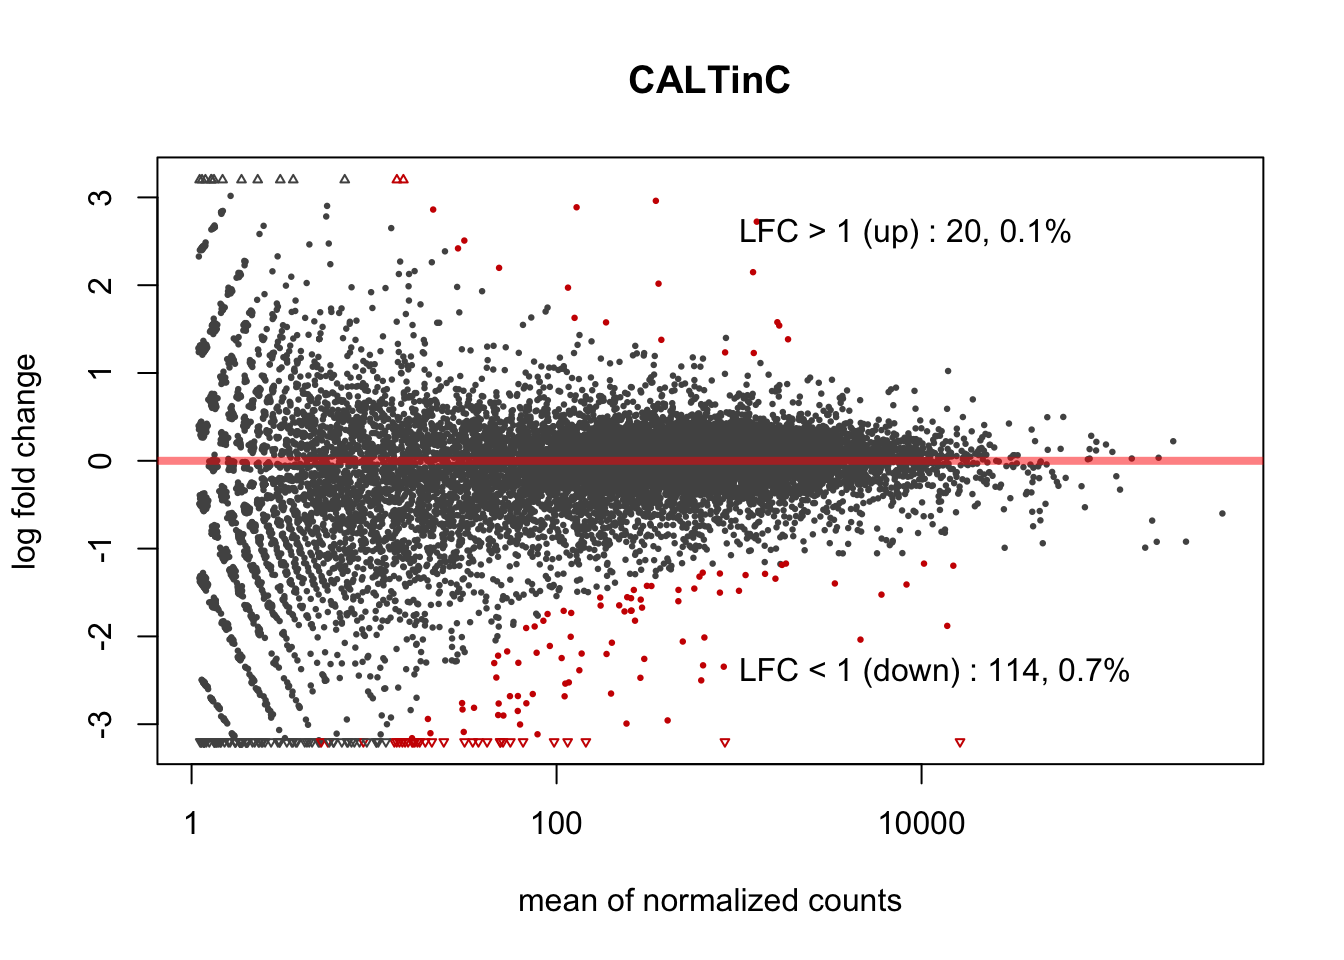
Figure 3.3: MA plot of DUXC-ALT expression in canine
Showing below is a venn diagram showing the overlaps of the down-regulates of DUX, DUX4, and DUXC-ALT.
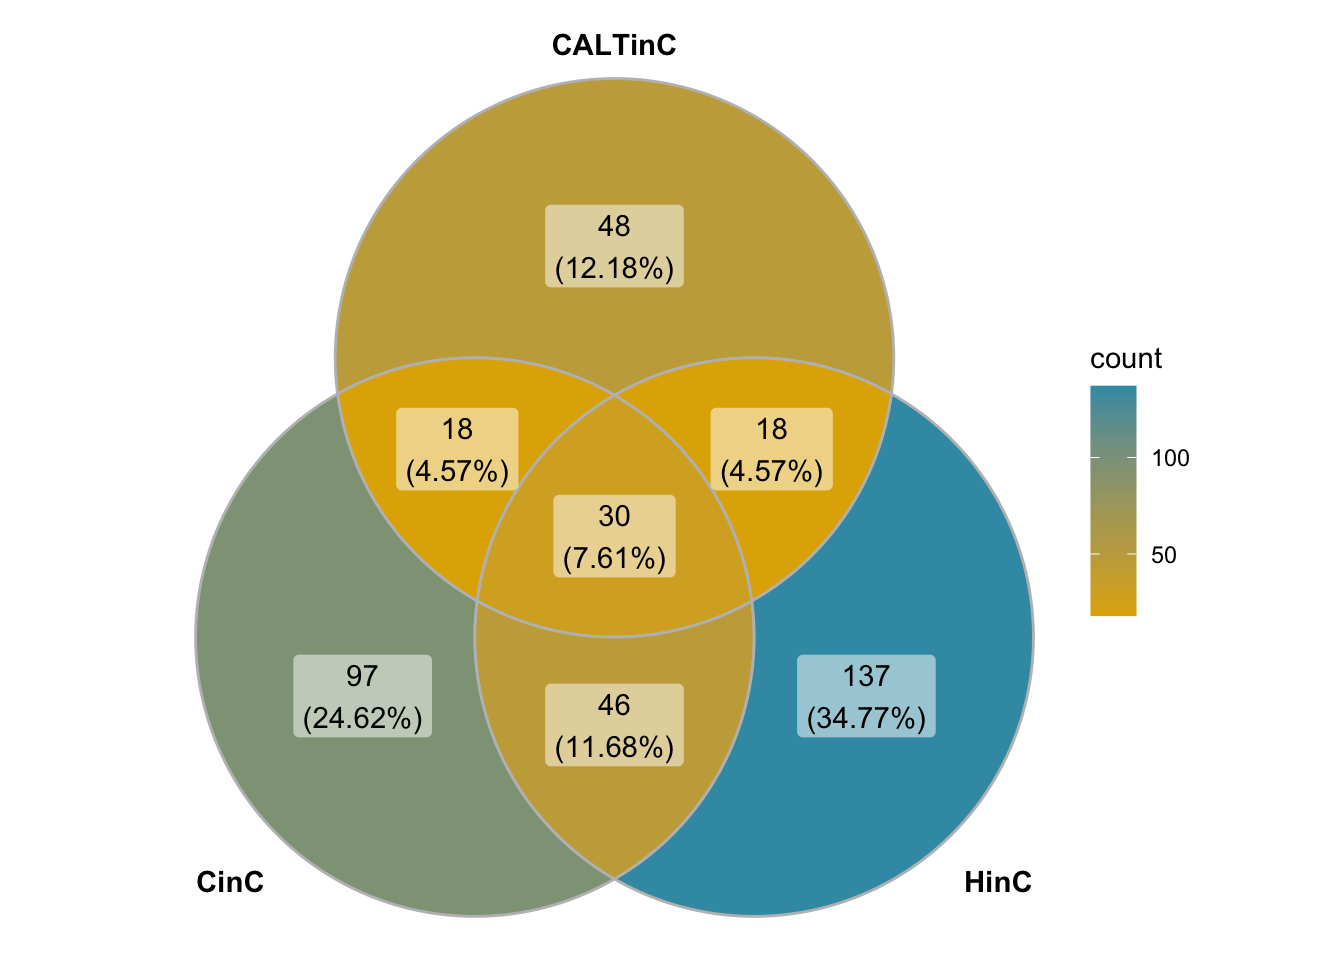
Figure 3.4: Venn diagram of down-regualated genes in DUXC, DUX4 and DUXC-ALTC.
NOTE: DUXC-ALT up-regulated 20 genes and nine of them are overlapped with the up-regulated by DUXC – JAG1, NPTX1, ID1, ODAPH, DHRS9, SLC2A2, SYT4, SERPINB12, TRAPPC3L.
GO analysis for the down-regulated gene set
The down-regulated genes of DUXC-ALT are interesting; they might reveals the repressive functions that the conservative c-terminal regulates. Below is the top 10 repressed GO terms for the DUXC-ALT down-reguated.
Top 10 GO terms
knitr::kable(enriched.BP[1:10, c("category",
                                 "over_represented_pvalue",
"numInCat", "numDEInCat", "term")])| category | over_represented_pvalue | numInCat | numDEInCat | term |
|---|---|---|---|---|
| GO:0009607 | 0e+00 | 270 | 19 | response to biotic stimulus |
| GO:0043207 | 0e+00 | 253 | 18 | response to external biotic stimulus |
| GO:0051707 | 0e+00 | 253 | 18 | response to other organism |
| GO:0009615 | 0e+00 | 96 | 11 | response to virus |
| GO:0051704 | 0e+00 | 557 | 22 | multi-organism process |
| GO:0098542 | 0e+00 | 115 | 11 | defense response to other organism |
| GO:0006952 | 0e+00 | 377 | 18 | defense response |
| GO:0051607 | 0e+00 | 70 | 9 | defense response to virus |
| GO:0009605 | 0e+00 | 656 | 23 | response to external stimulus |
| GO:0045087 | 2e-07 | 187 | 12 | innate immune response |
3.3 Cross-species models: DUX4 expression in canine and murine
This section shows the comparison of the cross-species models of DUX4 expression in canine and murine: the correlation of gene expression (assembled by log2 fold change) induced by DUX4 and DUXC is significant (Pearson=\(0.83\)) whereas that of DUX4 and Dux in murine is weak (Pearson=\(0.275\)).
.tidy_results <- function(dds, lfcThreshold=1, alpha=0.05) {
  res <- results(dds, lfcThreshold=lfcThreshold, alpha=alpha)
  as(res, "data.frame") %>%
    rownames_to_column(var="ENSEMBL") %>%
    dplyr::select(ENSEMBL, log2FoldChange, padj)
}
# get linear regression model
lm_eqn <- function(df){
    m <- lm(y ~ x, df);
    eq <- substitute(italic(y) == a + b %.% italic(x)*","~~italic(r)~"="~r2,
         list(a = format(unname(coef(m)[1]), digits = 2),
              b = format(unname(coef(m)[2]), digits = 2),
              r2 = format(sqrt(summary(m)$r.squared), digits = 3)))
    as.character(as.expression(eq));
}
# tidy up the DESeq2 results
CinC <- .tidy_results(CinC.ens.dds) %>%
  dplyr::rename(CANINE_ENSEMBL=ENSEMBL, CinC_logFC=log2FoldChange,
                CinC_padj=padj)
HinC <- .tidy_results(HinC.ens.dds) %>%
   dplyr::rename(CANINE_ENSEMBL=ENSEMBL, HinC_logFC=log2FoldChange,
                 HinC_padj=padj)
MinM <- .tidy_results(C2C12.ens.ddsl2$MinMvsNODOX) %>%
   dplyr::rename(MOUSE_ENSEMBL=ENSEMBL, MinM_logFC=log2FoldChange,
                 MinM_padj=padj)
HinM <- .tidy_results(C2C12.ens.ddsl2$HinMvsNODOX) %>%
   dplyr::rename(MOUSE_ENSEMBL=ENSEMBL, HinM_logFC=log2FoldChange,
                 HinM_padj=padj)
3.3.1 DUX4 and DUXC expression in canine
Pearson correlation between DUX4 and DUXC expression (assembled by logFC) in canine is \(0.803\). Code below draws the 2D density plot below presenting their linear relationship: dashed line is the linear regression line \(y=0.11 + 0.8x\) whereas the solid line is \(x=y\).
HinC_CinC <- HinC %>%
  left_join(CinC, by="CANINE_ENSEMBL") %>%
  dplyr::filter(!is.na(HinC_logFC), !is.na(CinC_logFC))

df <- HinC_CinC %>% dplyr::select(HinC_logFC, CinC_logFC) %>%
  dplyr::rename(y=HinC_logFC, x=CinC_logFC)
label <- lm_eqn(df)
gg <- ggplot(HinC_CinC, aes(x=CinC_logFC, y=HinC_logFC)) +
  stat_density2d(geom="tile", aes(fill=..density..^0.15, alpha=1),
                 contour=FALSE, show.legend=FALSE) +
  geom_point(size=0.5) +
  stat_density2d(geom="tile", aes(fill=..density..^0.15,
                                  alpha=ifelse(..density..^0.15<0.3,0,1)),
                 contour=FALSE, show.legend=FALSE) +
  scale_fill_gradientn(colours = colorRampPalette(c("white", blues9))(256)) +
  geom_smooth(method="lm", se=FALSE, show.legend=FALSE, color="gray25",
              alpha=0.5,
              linetype="dashed") +
  geom_abline(slope=1, intercept=0, color="gray25", alpha=0.5) +
  labs(title=TeX("HinC vs. CinC $\\log_2$ fold change"),
       y=TeX("HinC: $\\log_2$(DUX4/luciferase)"),
       x=TeX("CinC: $\\log_2$(DUXC/luciferase)")) +
  theme_bw() +
  theme(plot.title = element_text(hjust = 0.5, face="bold", size=16)) +
  geom_text(x=7.5, y=7.5, label="x=y", angle=38, vjust=-1, color="gray25") +
  geom_text(x=7.5, y=5.5, label="y=0.11+0.8x; pearson=0.803", angle=28,
            vjust=1, color="gray25")
gg
## `geom_smooth()` using formula 'y ~ x'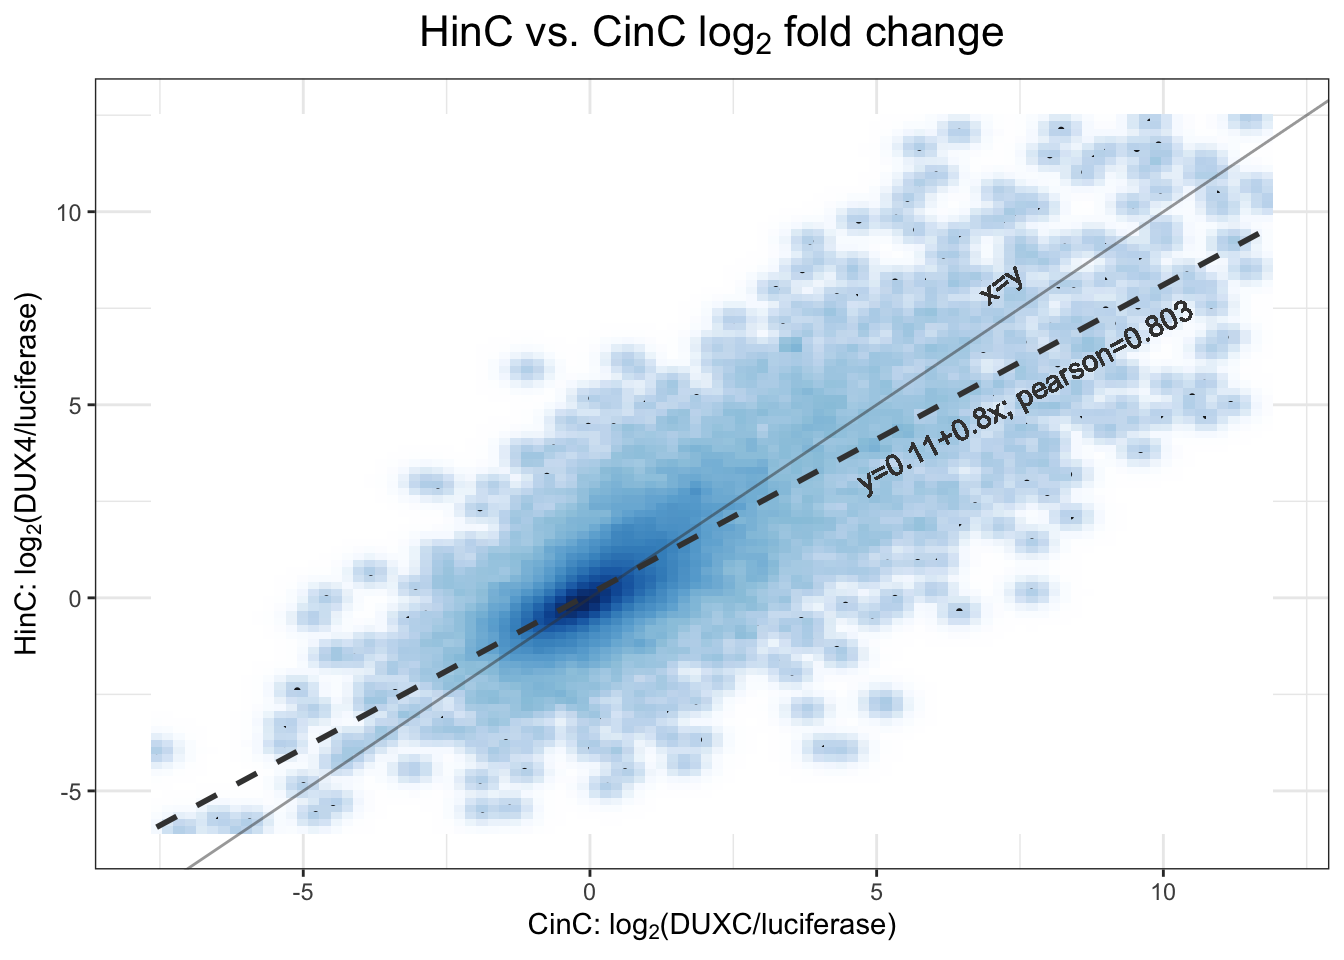
Figure 3.5: 2D density scatter plot between DUX4 and DUXC expression in canine.
## `geom_smooth()` using formula 'y ~ x'3.3.2 DUX4 and Dux expression in murine
Pearson correlation between DUX4 and Dux expression in murine is \(0.275\); linear regression model is \(y=-0.024 + 0.21x\).
HinM_MinM <- HinM %>%
  left_join(MinM, by="MOUSE_ENSEMBL") %>%
  dplyr::filter(!is.na(HinM_logFC), !is.na(MinM_logFC))

df <- HinM_MinM %>% dplyr::select(HinM_logFC, MinM_logFC) %>%
  dplyr::rename(y=HinM_logFC, x=MinM_logFC)
label <- lm_eqn(df)
gg <- ggplot(HinM_MinM, aes(x=MinM_logFC, y=HinM_logFC)) +
  stat_density2d(geom="tile", aes(fill=..density..^0.15, alpha=1),
                 contour=FALSE, show.legend=FALSE) +
  geom_point(size=0.5) +
  stat_density2d(geom="tile", aes(fill=..density..^0.15,
                                  alpha=ifelse(..density..^0.15<0.3,0,1)),
                 contour=FALSE, show.legend=FALSE) +
  scale_fill_gradientn(colours = colorRampPalette(c("white", blues9))(256)) +
  geom_smooth(method="lm", se=FALSE, show.legend=FALSE, color="gray25",
              alpha=0.5,
              linetype="dashed") +
  geom_abline(slope=1, intercept=0, color="gray25", alpha=0.5) +
  labs(title=TeX("HinM vs. MinM $\\log_2$ fold change"),
       y=TeX("HinM: $\\log_2$(DUX4/no DUX4)"),
       x=TeX("MinM: $\\log_2$(Dux/no Dux)")) +
  theme_bw() +
  theme(plot.title = element_text(hjust = 0.5, face="bold", size=16)) +
  geom_text(x=10, y=10, label="x=y", angle=38, vjust=-1, color="gray25") +
  geom_text(x=10, y=1.4, label="y=-0.024+0.21x; pearson=0.275", angle=8,
            vjust=1, color="gray25")

gg
## `geom_smooth()` using formula 'y ~ x'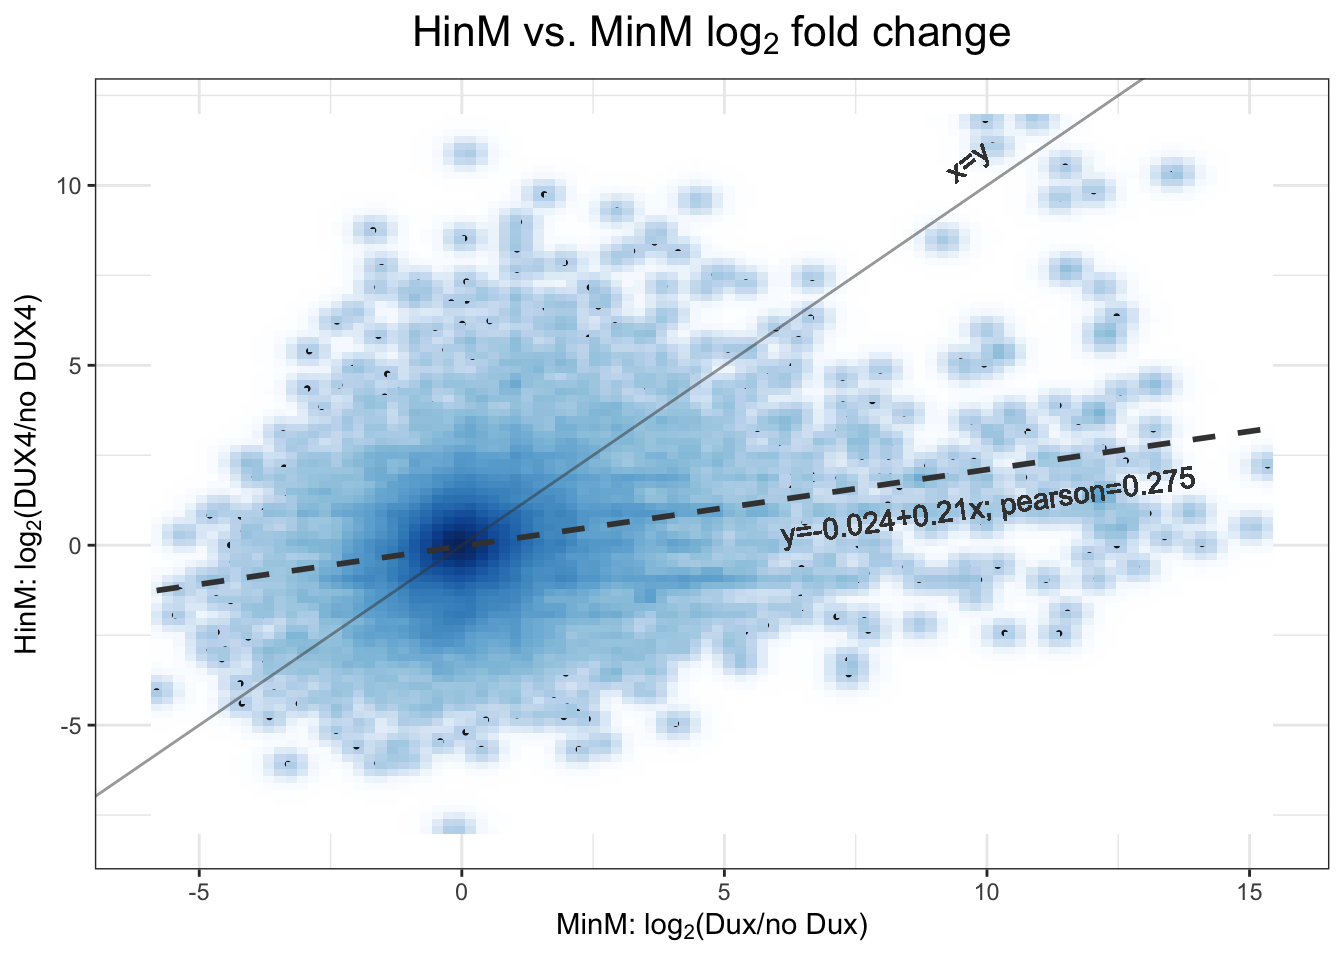
Figure 3.6: 2D density scatter plot between DUX4 and Dux expression in murine.
## `geom_smooth()` using formula 'y ~ x'