B DUX4 basket genes curation
B.1 Aims and flowchard
Our aim here is to create a curated list of DUX4 basket genes that best represent the DUX4 signature of FSHD. Judit Balog Zizhen Yao Lauren Snider3 et al. identified 67 DUX4 robust genes significantly up-regulated in DUX4-target-positive FSHD biopsy samples, FSHD myotubes, and DUX4-transduced cells. The complete list of these genes can be found in Yao’s supplementary table 3 or the ddu251supp_table3.xls excel sheet saved here.
Out the 67 candidates, we selected the genes that better distinguish moderately affected FSHDs from the controls. These genes would help us in detecting DUX4-targeted muscle, building a better prediction model based on MRI characteristics, and establishing standards for post-therapeutic measurements. This process involves three major steps:
- Converted the coordinates/annotation of the genes to GRCh38 (hg38) and more modern versions of Ensembl or Gencode since in Yao’s study, the alignments and annotation of the RNA-seq data were done based upon genome build hg19. Filtered un-annotated, duplicated genes and variants.
- Validated the significance of this set of genes using the muscle biopsy RNA-seq data from the Wellstone longitudinal study (Dennis Shaw Leo H. Wang Seth D. Friedman4, Seth D. Friedman Chao-Jen Wong Leo H. Wang5). This study used k-mean clustering to identify five distinctive groups of samples, based on their RNA expression levels, and labelled them as Mild, Moderate, IG-High, High, and Muscle-Low.
- Ultimately, curated baskets of genes whose expression levels are best in discriminating between the Mild/Moderated FSHD biopsies and the controls ranked by both classification-based (ROC) and hypothesis-based (DESeq2) methods. This subsequent genes will be helpful for therapeutic or post-therapeutic measures.
Note: all the results and figures are generated on the fly.
B.2 Flowchart
knitr::include_graphics("images/flowchart-DUX4-baskets.png")
Figure B.1: Flowchart of basket selections
B.3 Convert to GRCh38/Ensembl
First, load libraries and data sets.
suppressPackageStartupMessages(library(tidyverse))
suppressPackageStartupMessages(library(DESeq2))
suppressPackageStartupMessages(library(writexl))
suppressPackageStartupMessages(library(kableExtra))
suppressPackageStartupMessages(library(knitr))
suppressPackageStartupMessages(library(kableExtra))
library(BiocParallel)
bp_param = MulticoreParam(workers=4L)
register(bp_param)

pkg_dir <- "/Users/cwon2/CompBio/Wellstone_BiLateral_Biopsy"
source(file.path(pkg_dir, "scripts", "load_variables_and_datasets.R"))
# returns bilat_dds, longitudinal_dds, and annotation dataframe in ens88 (anno_gencode35) and gencode35 (anno_gencode35)

# sanity check
colnames(longitudinal_dds)  = longitudinal_dds$sample_name
Second, upload Yao’s 2014 suppl. table 3:
# load xls and tidy it
targets <- readxl::read_xls(file.path(pkg_dir, "extdata",
                                      "ddu251supp_table3.xls"),
                            skip = 1, sheet=1) %>%
  dplyr::select(ENSEMBL, gene.name) %>%
  dplyr::rename(gene_name = gene.name)
About the original 67:
- KHDC1L appeared twice (suppl_table3) with different identifiers, ENSG00000243501 and ENSG00000256980 in hg19’s Esembl annotation. But in GRCh38, ENSG00000243501 is annotated as KHDC1.
- PRAMEF3 and WI2-2994D6.1 cannot be
liftOverto GRCh38 - regions are deleted and are not converted - XX-FW84067D5.1
liftOverto PRAMEF8 and WI2-3308P17.2liftOverto PRAMEF11. But both PRAMEF8 and PRAMEF11 are already on the original 67 gene list. So we consider XX-FW84067D5.1 and WI2-3308P17.2 duplicated and therefore drop them from the list. - There are some variants whose expression levels are highly correlated. They added no extra values for classification performance. So we might exclude them from the final selection of best performed baskets.
Steps to convert to GRCh38/Ensembl (v88):
- Match gene names first
- Change ENSG00000243501’s gene name (KHDC1L) in hg38 to KHDC1 (note that in Gencode 40 or above, this might be annotated as KHDC1L-AS)
- If gene names are not matched, use UCSC genome browser
liftOverto find the converted annotation and position in GRCh38 -
Column keep of the data frame flags (
FALSE) the un-annotated, duplicated (XX-FW84067D5.1 and WI2-3308P17.2), and variants genes whose expression and differential statistics are highly correlated to each other
Unmatched genes and used UCSC genome browser to liftOver:
- WI2-2994D6.2: PRAMEF 26 (PRAMEF25 variant)
-
PRAMEF3: unable to
liftOver; the region was deleted from GRCh38 - RP13-221M14.1: PRAMEF25, maybe also HNRNPCL4?
- WI2-3308P17.2: PRAMEF11 (PRAMEF27), a PRAMEF9/15 variants
- RP13-221M14.3: PRAMEF34P (PRAMEF36P psudogenes)
- RP13-221M14.5: HNRNPCL2, might be a PRAMEF9 variant in GRCh38/Ensembl v88
- TRIM49DP: TRIM49D1
- TRIM49L1: TRIM49D2 (TRIM49D1 and TRIM49D2 are variants of TRIM49)
-
WI2-2994D6.1: Unable to
liftOver - XX-FW84067D5.1: PRAMEF8
- AC010606.1: MBD3L2B. Alternative name CTB-25J19.1.
B.3.1 Match and liftOver
Code chunks below perform the steps above - match gene names and edit the liftOver annotation and tidy the results.
# tools
get_id_by_name = function(g_name) {
  if (g_name=="no identifier") return(NA)
  anno_ens88 %>% dplyr::filter(gene_name %in% g_name) %>% pull(ens88_id)
  #annotation %>% dplyr::filter(gene_name %in% g_name) %>% pull(gene_id)
}

# 1. matche name
# 2. if names are not matched, use liftOver results
DUX4_targets_GRCh38 = targets %>% left_join(anno_ens88, by="gene_name",
                                   suffix=c(".hg19", ".hg38")) %>%
    dplyr::mutate(match_name = !is.na(ens88_id)) %>%
    dplyr::mutate(gene_name.hg38 = case_when(
      ENSEMBL == "ENSG00000243501" ~ "KHDC1",
      gene_name == "WI2-2994D6.2" ~ "PRAMEF26",
      gene_name == "PRAMEF3" ~ "no identifier",
      gene_name == "RP13-221M14.1" ~ "PRAMEF25",
      gene_name == "WI2-3308P17.2" ~ "PRAMEF11",
      gene_name == "RP13-221M14.5" ~ "HNRNPCL2",
      gene_name == "RP13-221M14.3" ~ "PRAMEF34P",
      gene_name == "TRIM49DP" ~ "TRIM49D1",
      gene_name == "TRIM49L1" ~ "TRIM49D2",
      gene_name == "WI2-2994D6.1" ~ "no identifier",
      gene_name == "XX-FW84067D5.1" ~ "PRAMEF8",
      gene_name == "AC010606.1" ~ "CTB-25J19.1",
    TRUE ~ gene_name
  )) %>% # 3. fixed gene_id and ENSEMBL.hg38
  dplyr::mutate(ens88_id = if_else(is.na(ens88_id),
                                  map_chr(gene_name.hg38, get_id_by_name),
                                  ens88_id)) %>%
  dplyr::mutate(ens88_id = if_else(gene_name.hg38 == "KHDC1",
                                  map_chr(gene_name.hg38, get_id_by_name), ens88_id)) %>%
  dplyr::rename(ENSEMBL.hg19 = ENSEMBL, gene_name.hg19 = gene_name,
                gene_id.hg38 = ens88_id) %>%
  dplyr::mutate(ENSEMBL.hg38 = str_replace(gene_id.hg38, "\\..*", "")) # remove ensembl version
B.3.2 Exclude unannotated, duplicated, and variant genes
We excluded the following genes for the candidates of DUX4 baskets. 1. two un-annotated (PRAMEF3, WI2-2994D6.1) genes 2. two (XX-FW84067D5.1-> PRAMEF8, WI2-3308P17.2 -> PRAMEF11) duplicated genes 3. ten variants of TRIM49, TRIM51, TRIM43 whose gene expression levels are highly correlated with TRIM49, TRIM51, and TRIM43.
Those are marked as FALSE in Column keep of our data.frame. We might not consider these genes when selecting the baskets of genes. Now, total 53 genes are retained as candidates for the DUX4 signature basket.
Variants
- TRIM49D1: variant of TRIM49; both have similar gene counts (longitudinal biopsy study)
- TRIM49D2: variant of TRIM49; both have similar gene counts
- TRIM49C: variant of TRIM49; both have similar gene counts
- TRIM49B: variant of TRIM49; both have similar gene counts
- TRIM53AP: might share the promoter of TRIM49; both have similar gene counts
- TRIM51EP: variant of TRIM51
- TRIM51BP: variant of TIRM51
- TRIM51CP: variant of TRIM51
- TRIM43B: variant of TRIM43
- TRIM43CP: variant of TRIM43
display the table.
#save(DUX4_targets_GRCh38, file=file.path(pkg_dir, "data", "DUX4_targets_GRCh38.rda"))

# color genes in basket blue, o/w green
tb <- DUX4_targets_GRCh38 %>%
  dplyr::mutate(gene_name.hg38 = kableExtra::cell_spec(gene_name.hg38,
                                                       color = if_else(keep, "blue", "green")))

knitr::kable(tb, format="html", escape = F,
             caption="LiftOver annotation of the original 67 DUX4 robust genes. Column keep: FALSE indicates the genes are unannotated in hg38/Ensembl, duplicated, or variants of similar statistics and expression within the family. Blue color (gene_name.hg38) indicates keep=TRUE, 53 genes retained as candidates for the selection of baskets.") %>%
  kableExtra::kable_styling(font_size = 12) %>%
  kableExtra::kable_paper() %>%
kableExtra::scroll_box(width = "800px", height="100%")| ENSEMBL.hg19 | gene_name.hg19 | gene_id.hg38 | ens_id | match_name | gene_name.hg38 | ENSEMBL.hg38 | keep |
|---|---|---|---|---|---|---|---|
| ENSG00000213921 | LEUTX | ENSG00000213921.6 | ENSG00000213921 | TRUE | LEUTX | ENSG00000213921 | TRUE |
| ENSG00000120952 | PRAMEF2 | ENSG00000120952.4 | ENSG00000120952 | TRUE | PRAMEF2 | ENSG00000120952 | TRUE |
| ENSG00000232423 | PRAMEF6 | ENSG00000232423.5 | ENSG00000232423 | TRUE | PRAMEF6 | ENSG00000232423 | TRUE |
| ENSG00000204501 | PRAMEF9 | ENSG00000204505.4 | ENSG00000204505 | TRUE | PRAMEF9 | ENSG00000204505 | TRUE |
| ENSG00000204502 | PRAMEF5 | ENSG00000270601.4 | ENSG00000270601 | TRUE | PRAMEF5 | ENSG00000270601 | TRUE |
| ENSG00000157358 | PRAMEF15 | ENSG00000204501.6 | ENSG00000204501 | TRUE | PRAMEF15 | ENSG00000204501 | TRUE |
| ENSG00000204513 | PRAMEF11 | ENSG00000239810.3 | ENSG00000239810 | TRUE | PRAMEF11 | ENSG00000239810 | TRUE |
| ENSG00000229571 | WI2-2994D6.2 | ENSG00000280267.3 | NA | FALSE | PRAMEF26 | ENSG00000280267 | TRUE |
| ENSG00000243073 | PRAMEF4 | ENSG00000243073.3 | ENSG00000243073 | TRUE | PRAMEF4 | ENSG00000243073 | TRUE |
| ENSG00000204503 | PRAMEF3 | NA | NA | FALSE | no identifier | NA | FALSE |
| ENSG00000204491 | PRAMEF18 | ENSG00000279804.1 | ENSG00000279804 | TRUE | PRAMEF18 | ENSG00000279804 | TRUE |
| ENSG00000204510 | PRAMEF7 | ENSG00000204510.5 | ENSG00000204510 | TRUE | PRAMEF7 | ENSG00000204510 | TRUE |
| ENSG00000204481 | PRAMEF14 | ENSG00000204481.7 | ENSG00000204481 | TRUE | PRAMEF14 | ENSG00000204481 | TRUE |
| ENSG00000204495 | PRAMEF13 | ENSG00000279169.1 | ENSG00000279169 | TRUE | PRAMEF13 | ENSG00000279169 | TRUE |
| ENSG00000204480 | PRAMEF19 | ENSG00000204480.7 | ENSG00000204480 | TRUE | PRAMEF19 | ENSG00000204480 | TRUE |
| ENSG00000204485 | XX-FW84067D5.1 | ENSG00000182330.10 | NA | FALSE | PRAMEF8 | ENSG00000182330 | FALSE |
| ENSG00000204479 | PRAMEF17 | ENSG00000204479.4 | ENSG00000204479 | TRUE | PRAMEF17 | ENSG00000204479 | TRUE |
| ENSG00000182330 | PRAMEF8 | ENSG00000182330.10 | ENSG00000182330 | TRUE | PRAMEF8 | ENSG00000182330 | TRUE |
| ENSG00000204505 | RP13-221M14.1 | ENSG00000229571.6 | NA | FALSE | PRAMEF25 | ENSG00000229571 | TRUE |
| ENSG00000239810 | WI2-3308P17.2 | ENSG00000239810.3 | NA | FALSE | PRAMEF11 | ENSG00000239810 | FALSE |
| ENSG00000116721 | PRAMEF1 | ENSG00000116721.9 | ENSG00000116721 | TRUE | PRAMEF1 | ENSG00000116721 | TRUE |
| ENSG00000187545 | PRAMEF10 | ENSG00000187545.5 | ENSG00000187545 | TRUE | PRAMEF10 | ENSG00000187545 | TRUE |
| ENSG00000116726 | PRAMEF12 | ENSG00000116726.4 | ENSG00000116726 | TRUE | PRAMEF12 | ENSG00000116726 | TRUE |
| ENSG00000179172 | HNRNPCL1 | ENSG00000179172.8 | ENSG00000179172 | TRUE | HNRNPCL1 | ENSG00000179172 | TRUE |
| ENSG00000179412 | RP13-221M14.5 | ENSG00000275774.2 | NA | FALSE | HNRNPCL2 | ENSG00000275774 | TRUE |
| ENSG00000229978 | RP13-221M14.3 | ENSG00000277862.1 | NA | FALSE | PRAMEF34P | ENSG00000277862 | TRUE |
| ENSG00000224199 | WI2-2994D6.1 | NA | NA | FALSE | no identifier | NA | FALSE |
| ENSG00000144010 | TRIM43B | ENSG00000144010.8 | ENSG00000144010 | TRUE | TRIM43B | ENSG00000144010 | FALSE |
| ENSG00000144015 | TRIM43 | ENSG00000144015.4 | ENSG00000144015 | TRUE | TRIM43 | ENSG00000144015 | TRUE |
| ENSG00000144188 | TRIM43CP | ENSG00000144188.9 | ENSG00000144188 | TRUE | TRIM43CP | ENSG00000144188 | FALSE |
| ENSG00000223417 | TRIM49DP | ENSG00000223417.8 | NA | FALSE | TRIM49D1 | ENSG00000223417 | FALSE |
| ENSG00000225581 | TRIM53AP | ENSG00000225581.3 | ENSG00000225581 | TRUE | TRIM53AP | ENSG00000225581 | FALSE |
| ENSG00000166013 | TRIM53BP | ENSG00000166013.11 | ENSG00000166013 | TRUE | TRIM53BP | ENSG00000166013 | TRUE |
| ENSG00000233802 | TRIM49L1 | ENSG00000233802.8 | NA | FALSE | TRIM49D2 | ENSG00000233802 | FALSE |
| ENSG00000204449 | TRIM49C | ENSG00000204449.3 | ENSG00000204449 | TRUE | TRIM49C | ENSG00000204449 | FALSE |
| ENSG00000168930 | TRIM49 | ENSG00000168930.13 | ENSG00000168930 | TRUE | TRIM49 | ENSG00000168930 | TRUE |
| ENSG00000254764 | TRIM53CP | ENSG00000254764.1 | ENSG00000254764 | TRUE | TRIM53CP | ENSG00000254764 | TRUE |
| ENSG00000182053 | TRIM49B | ENSG00000182053.12 | ENSG00000182053 | TRUE | TRIM49B | ENSG00000182053 | FALSE |
| ENSG00000204455 | TRIM51BP | ENSG00000204455.7 | ENSG00000204455 | TRUE | TRIM51BP | ENSG00000204455 | FALSE |
| ENSG00000237706 | TRIM51EP | ENSG00000237706.4 | ENSG00000237706 | TRUE | TRIM51EP | ENSG00000237706 | FALSE |
| ENSG00000249910 | TRIM51CP | ENSG00000249910.3 | ENSG00000249910 | TRUE | TRIM51CP | ENSG00000249910 | FALSE |
| ENSG00000124900 | TRIM51 | ENSG00000124900.12 | ENSG00000124900 | TRUE | TRIM51 | ENSG00000124900 | TRUE |
| ENSG00000251360 | KHDC1P1 | ENSG00000251360.2 | ENSG00000251360 | TRUE | KHDC1P1 | ENSG00000251360 | TRUE |
| ENSG00000243501 | KHDC1L | ENSG00000135314.12 | ENSG00000256980 | TRUE | KHDC1 | ENSG00000135314 | TRUE |
| ENSG00000256980 | KHDC1L | ENSG00000256980.4 | ENSG00000256980 | TRUE | KHDC1L | ENSG00000256980 | TRUE |
| ENSG00000178928 | TPRX1 | ENSG00000178928.8 | ENSG00000178928 | TRUE | TPRX1 | ENSG00000178928 | TRUE |
| ENSG00000169548 | ZNF280A | ENSG00000169548.3 | ENSG00000169548 | TRUE | ZNF280A | ENSG00000169548 | TRUE |
| ENSG00000133101 | CCNA1 | ENSG00000133101.9 | ENSG00000133101 | TRUE | CCNA1 | ENSG00000133101 | TRUE |
| ENSG00000235268 | KDM4E | ENSG00000235268.2 | ENSG00000235268 | TRUE | KDM4E | ENSG00000235268 | TRUE |
| ENSG00000249156 | RP11-432M8.9 | ENSG00000249156.1 | ENSG00000249156 | TRUE | RP11-432M8.9 | ENSG00000249156 | TRUE |
| ENSG00000248945 | RP11-432M8.17 | ENSG00000269466.2 | ENSG00000269466 | TRUE | RP11-432M8.17 | ENSG00000269466 | TRUE |
| ENSG00000250386 | RP11-432M8.11 | ENSG00000250386.1 | ENSG00000250386 | TRUE | RP11-432M8.11 | ENSG00000250386 | TRUE |
| ENSG00000230522 | MBD3L2 | ENSG00000230522.4 | ENSG00000230522 | TRUE | MBD3L2 | ENSG00000230522 | TRUE |
| ENSG00000196589 | AC010606.1 | ENSG00000196589.5 | NA | FALSE | CTB-25J19.1 | ENSG00000196589 | TRUE |
| ENSG00000237247 | MBD3L5 | ENSG00000237247.5 | ENSG00000237247 | TRUE | MBD3L5 | ENSG00000237247 | TRUE |
| ENSG00000182315 | MBD3L3 | ENSG00000182315.8 | ENSG00000182315 | TRUE | MBD3L3 | ENSG00000182315 | TRUE |
| ENSG00000205718 | MBD3L4 | ENSG00000205718.8 | ENSG00000205718 | TRUE | MBD3L4 | ENSG00000205718 | TRUE |
| ENSG00000171872 | KLF17 | ENSG00000171872.4 | ENSG00000171872 | TRUE | KLF17 | ENSG00000171872 | TRUE |
| ENSG00000251258 | RFPL4B | ENSG00000251258.1 | ENSG00000251258 | TRUE | RFPL4B | ENSG00000251258 | TRUE |
| ENSG00000257951 | RP11-554D14.4 | ENSG00000257951.1 | ENSG00000257951 | TRUE | RP11-554D14.4 | ENSG00000257951 | TRUE |
| ENSG00000163286 | ALPPL2 | ENSG00000163286.7 | ENSG00000163286 | TRUE | ALPPL2 | ENSG00000163286 | TRUE |
| ENSG00000215372 | ZNF705G | ENSG00000215372.6 | ENSG00000215372 | TRUE | ZNF705G | ENSG00000215372 | TRUE |
| ENSG00000157765 | SLC34A2 | ENSG00000157765.11 | ENSG00000157765 | TRUE | SLC34A2 | ENSG00000157765 | TRUE |
| ENSG00000204527 | DUXA | ENSG00000258873.2 | ENSG00000258873 | TRUE | DUXA | ENSG00000258873 | TRUE |
| ENSG00000236217 | C1DP2 | ENSG00000236217.4 | ENSG00000236217 | TRUE | C1DP2 | ENSG00000236217 | TRUE |
| ENSG00000128253 | RFPL2 | ENSG00000128253.13 | ENSG00000128253 | TRUE | RFPL2 | ENSG00000128253 | TRUE |
| ENSG00000180532 | ZSCAN4 | ENSG00000180532.10 | ENSG00000180532 | TRUE | ZSCAN4 | ENSG00000180532 | TRUE |
B.4 Rank significance by DESeq2 and ROC curves
Out of the 53 retained candidates, we aim to select the genes that are best in in distinguishing mildly affected muscle from the controls. We ranked their performance in both hypothesis-based and classification-based approached:
Steps:
Use longitudinal RNA-seq data in which FSHD biopsies were classified as Mild, Moderate, IG-High and High groups (based upon the gene expression levels).
- Hypothesis testing approach - used DESeq2 to estimate the fold changes and adjusted p-values by comparing different groups of FHSD (Mild, Moderate, Mild+Moderate, IG-High, High) to the controls. We used the statistics from the Mild+Moderate vs. controls comparison.
-
Classification-based approach - used ROC curves to evaluate the performance whose expression levels (
rlog), individually, is able to discriminate between Mold+Moderate and control groups. The partial area under curve (pAUC) criterion is set to 0.2 (1 - specificity). - Combine ranks yielded by DESeq (adjusted p-value) and ROC curves (pAUC).
- Consider average expression level (TPM) threshold in IG-High and High group: avg. TPM > 2.
- Retain significant genes in the Mild+Moderate samples relative to the controls (34)
- Select smaller baskets (6 and 12) of best performed genes from Step 5.
B.4.1 DESeq2: Differential analysis
Chunk below performs DESeq2 differential analysis comparing Mild, Moderate, Mild+Moderate, IG-High, and High groups to the controls. Out of 53, 40 candidates are significant in comparing Mild+Moderate samples with the controls.
Criteria for significance: adjusted p-value < 0.0.5 corresponding to \(H_0:|logFC(\frac{FSHD}{control})| \leq 1\).
#sanity check
colnames(longitudinal_dds) == longitudinal_dds$sample_name
dds <- longitudinal_dds
DESeq2::design(dds) <- formula(~ cluster)
dds <- DESeq(dds, BPPARAM=bp_param)
Tidy up the statistics from all five comparisons:
# get logFC for all five comparison against controls
basket <- DUX4_targets_GRCh38 %>% dplyr::filter(keep) #53

logFC <- map_dfr(resultsNames(dds)[c(2:5)], function(rname) {
  res <- as.data.frame(results(dds, name=rname, alpha=0.05, lfcThreshold=1)) %>%
    rownames_to_column(var="ens88_id") %>%
    dplyr::select(ens88_id, log2FoldChange, padj) %>%
    dplyr::mutate(sig = padj < 0.05, contrast=rname) %>%
    dplyr::filter(ens88_id %in% basket$gene_id.hg38) %>%
    dplyr::mutate(contrast=rname)
}) %>% dplyr::left_join(anno_ens88, by="ens88_id") %>%
  dplyr::mutate(sig = if_else(is.na(padj), FALSE, sig)) %>%
  dplyr::mutate(contrast = sapply(str_split(contrast, "_"), "[[", 2))
Chunk below performs Mild+Moderate vs. Controls:
# mild+moderate
sub_dds <- dds[, dds$cluster %in% c("Control", "Mild", "Moderate")]
design(sub_dds) <- formula(~ pheno_type)
sub_dds <- DESeq(sub_dds)
sub_res <- as.data.frame(results(sub_dds)) %>%
  rownames_to_column(var="ens88_id") %>%
  dplyr::select(ens88_id, log2FoldChange, padj) %>%
  dplyr::mutate(sig = padj < 0.05, contrast="Mild+Moderate") %>%
  dplyr::filter(ens88_id %in% basket$gene_id.hg38) %>%
  dplyr::left_join(anno_ens88, by="ens88_id") %>%
dplyr::mutate(sig = if_else(is.na(padj), FALSE, sig)) 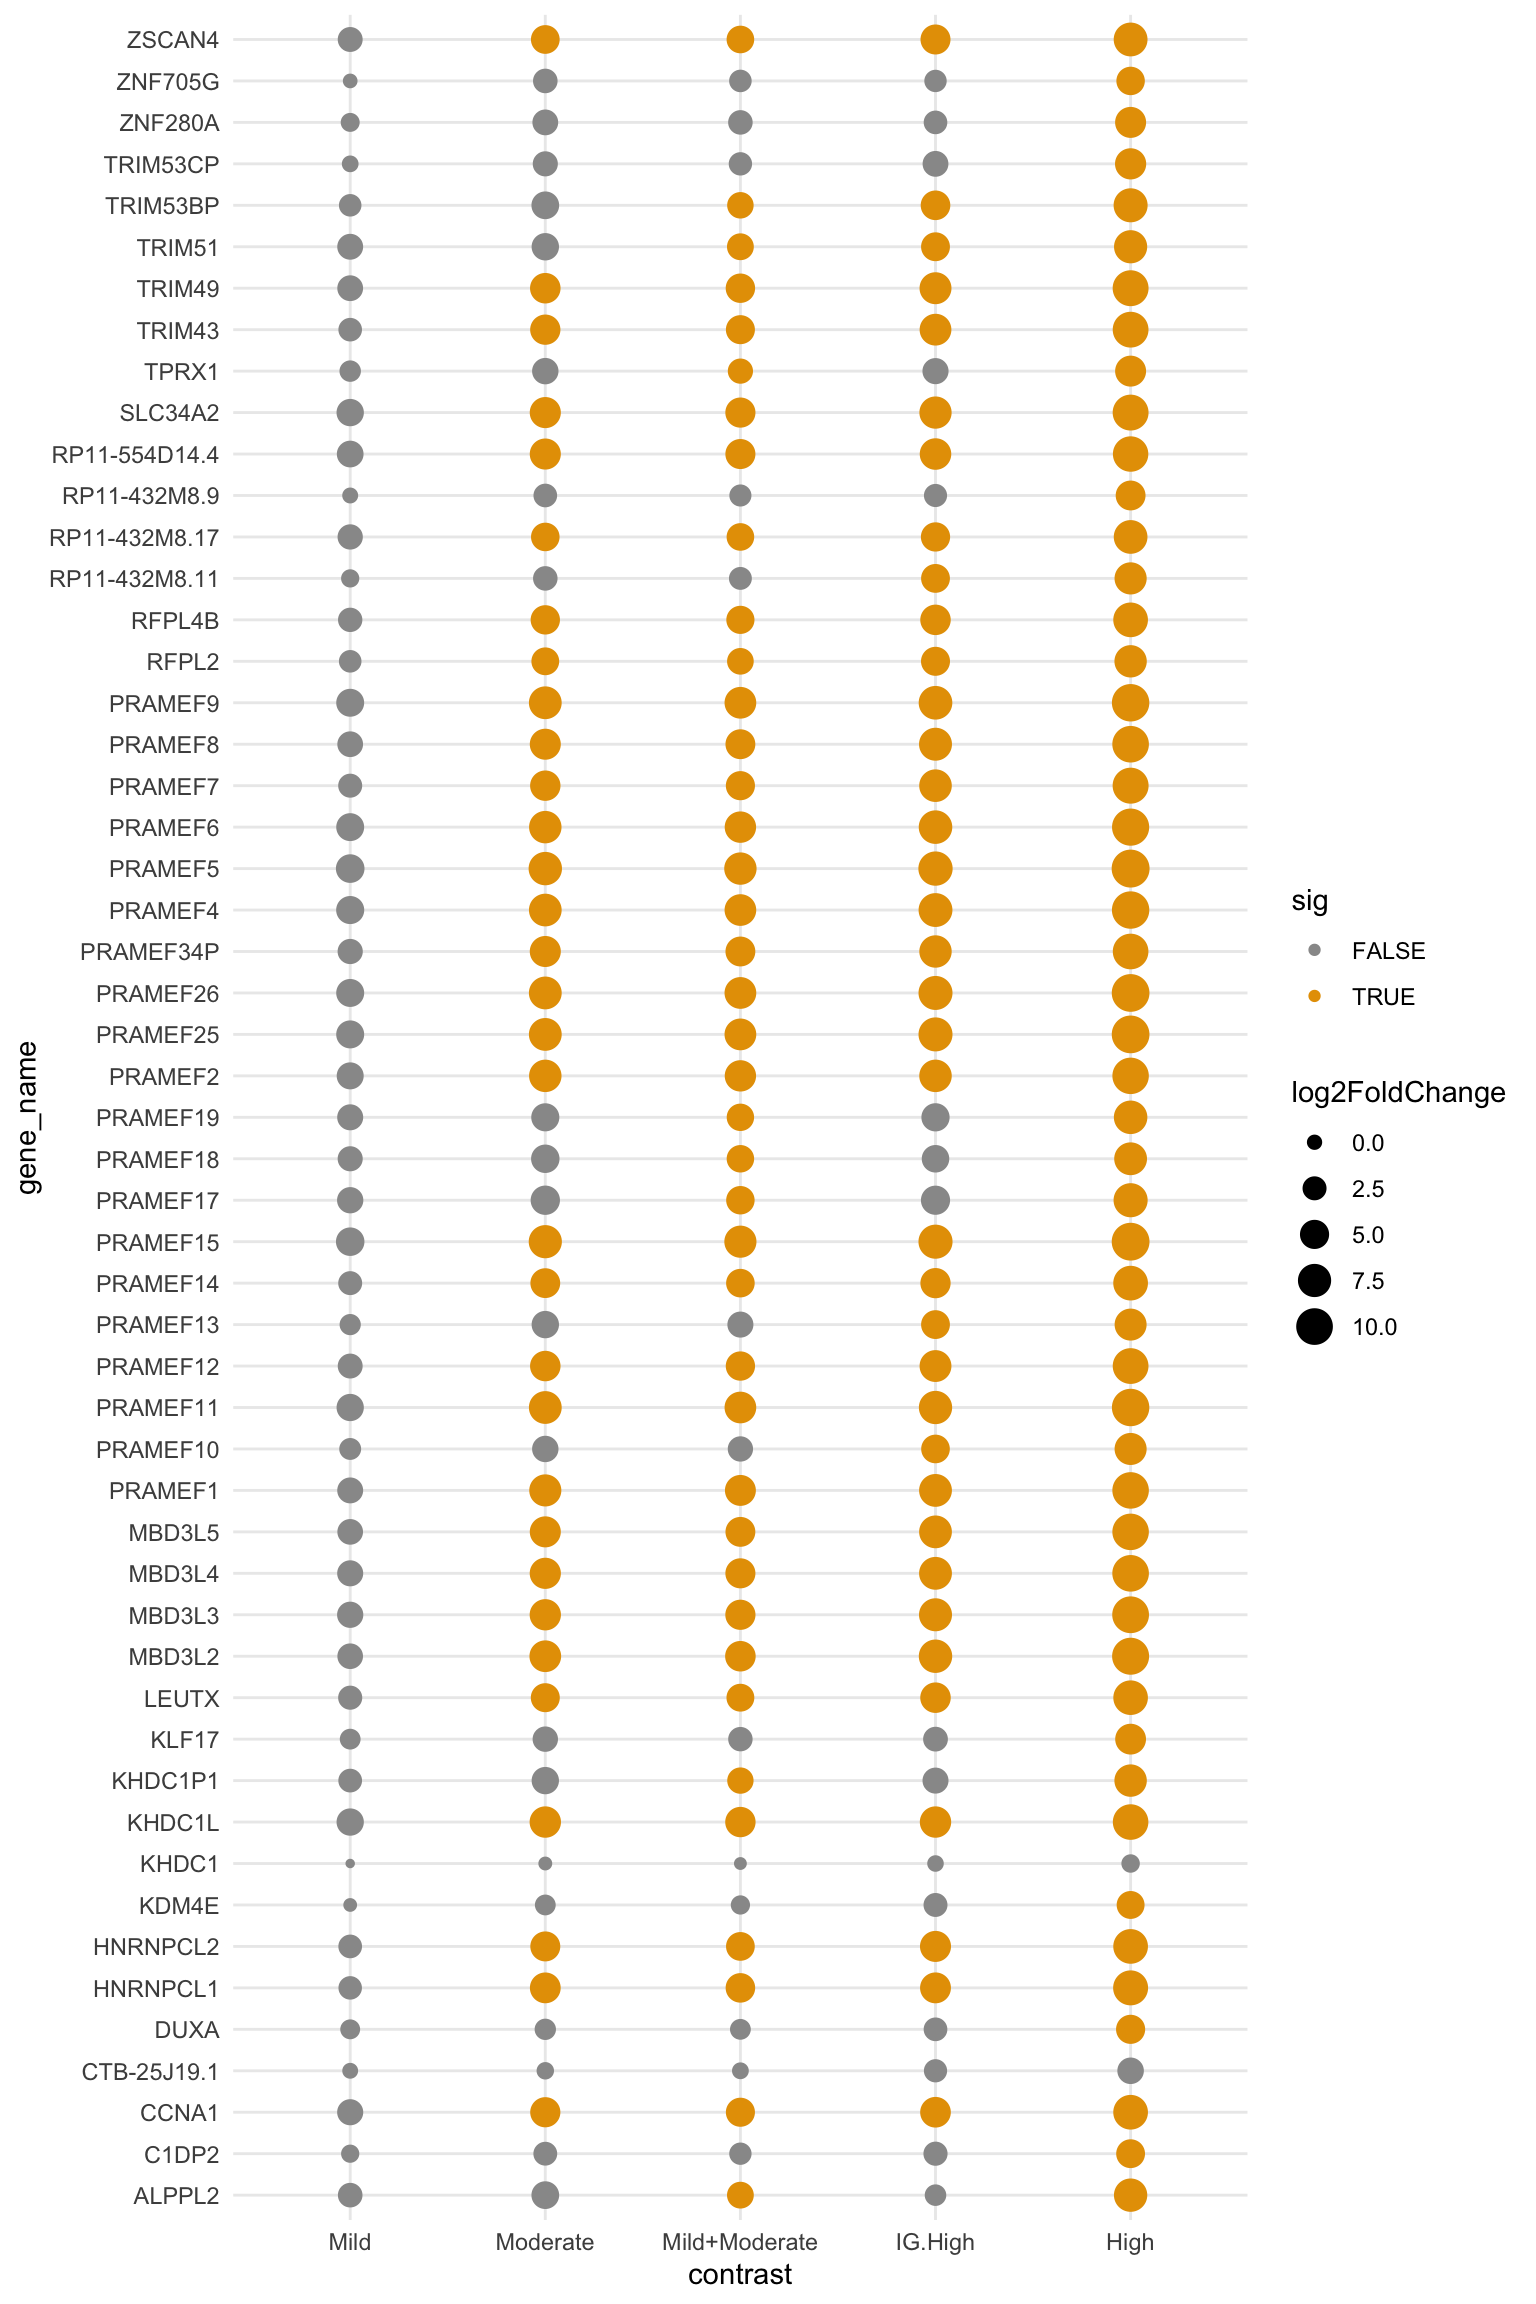
Figure B.2: Differential analysis results in comparing mild, moderate, mild+moderate, IG-high, and High groups to the controls. Size of the dots indicate fold changes and color the significance (adjusted p-value < 0.05). Note that 40 out of 53 are significant in Mild+Moderate.
B.4.2 Receiver Operator Characteristic (ROC) curve
We used the ROC curve to evaluate the performance of a logistic regression model (Mild+Moderate vs Controls) using regularized log transformation of the gene counts. We ranked the 40 candidates by their ROC partial AUC (p=0.2, 1-specificity).
# In retrospect, I would use the `caret` package instead of `genefilter` to perform roc/auc tests
library(genefilter)
tmp = rlog(sub_dds)
sub_rlog <- tmp[df_sig$ens88_id, ]
# row-wise pAUC (0.2)
eset <- ExpressionSet(assay(sub_rlog))
eset$pheno_type <- sub_rlog$pheno_type
rocs <- genefilter::rowpAUCs(eset, "pheno_type", p=0.2)

# ROC results
df_roc <- data.frame(ens88_id = featureNames(eset), pAUC=genefilter::area(rocs)) %>%
  dplyr::left_join(anno_ens88, by="ens88_id") %>%
  dplyr::arrange(desc(pAUC)) %>%
  dplyr::mutate(rank_pAUC = 1:nrow(.))
B.5 Selections of the DUX4 baskets
Basket-M: basket of genes that are able to discriminate mild and moderate muscle biopsies from the controls
- Started with the 40 significant genes in the Mild+Moderate group with adjusted p-value < 0.05 (Mild+Moderate vs. controls)
- Exclude genes that have undetectable expression in the bilateral cohort (4)
- Exclude genes whose expression in the IG-High and High groups are less then 2 TPM
- 30 out of 40 meet the criteria
B.5.1 Validation using the Bilateral cohort
Basket-M12:
- A subset
Basekt-M - Considered combined ranks of DEseq2’s adjusted p-value and ROC’s pAUC in which p=0.2 (1-specificity)
- Get the top 12 based on combined rank, subject to: two or three from PRAMEF-family, TRIM-family, and MBD3L-family
- Result: PRAMEF4, PRAMEF15, CCNA1, PRAMEF5, ZSCAN4, KHDC1L, TRIM49, MBD3L2, RP11-432M8.17 (H3Y1), TRIM51, MBD3L3, HNRNPCL2, and TRIM43
Basket-M6:
- A subset of
Basekt-M12 - Select by rank and average TPM in Mild+Moderate (>0.25 TPM)
- One out of four PRAMEFs: select PRAMEF5 among the PRAMEF candidates (2, 4, 5, 15, 11) because of the highest TPM in the Mild+Moderate group
- Result: ZSCAN4, CCNA1, PRAMEF5, KHDC1L, MDB3L2, H3Y1 (RP11-432M8.17)
Basket-H4: LEUTX, PRAMEF2, TRAM43, and KHDC1L are the original top DUX4 biomarkers in discriminating “hot” FSHD from the controls (Zizhen Yao6)
Code chunk below tidies up the table and generates excel sheets.
candidates <- df_sig %>%
  # exclude genes with undetectable expression in the Bilat samples
  dplyr::inner_join(anno_gencode35, by="ens_id", suffix=c(".ens88", ".gencode35")) %>%
  dplyr::left_join(df_roc %>% dplyr::select(-gene_name, -ens_id), by="ens88_id")  %>%
  dplyr::mutate(combined_rank = (rank_pAUC + rank_deseq)/2) %>%
  dplyr::arrange(combined_rank) %>%
  dplyr::select(ens_id, ens88_id, gencode35_id, gene_name.ens88, gene_name.gencode35,
                log2FoldChange, padj, pAUC, rank_pAUC, rank_deseq, combined_rank)

tmp_high <- dds[candidates$ens88_id, dds$cluster %in% c("IG-High", "High")]
tmp_m <- sub_dds[candidates$ens88_id, sub_dds$pheno_type == "FSHD"]
tmp_bilat <- bilat_dds[candidates$gencode35_id]

DUX4_baskets <- candidates %>%
  dplyr::mutate(avgTPM_M = rowMeans(assays(tmp_m)[["TPM"]])) %>%
  dplyr::mutate(avgTPM_H = rowMeans(assays(tmp_high)[["TPM"]])) %>%
  dplyr::mutate(avgTPM_Bilat = rowMeans(assays(tmp_bilat)[["TPM"]])) %>%
  dplyr::mutate(`DUX4-M` = avgTPM_H >= 2) %>%
  dplyr::filter(`DUX4-M`) %>%
  dplyr::mutate(`DUX4-M12` = gene_name.ens88 %in%
                  c("PRAMEF4", "PRAMEF15", "CCNA1", "ZSCAN4", "PRAMEF5",
                    "KHDC1L", "TRIM49", "MBD3L2", "RP11-432M8.17", "MBD3L3",
                    "HNRNPCL2", "TRIM43")) %>%
  dplyr::mutate(`DUX4-M6` = gene_name.ens88 %in% c("ZSCAN4", "CCNA1", "PRAMEF5", "KHDC1L",
                                               "MBD3L2", "RP11-432M8.17")) %>%
  dplyr::mutate(`DUX4-H4` = gene_name.ens88 %in% c("PRAMEF2", "TRIM43", "KHDC1L", "LEUTX"))
Code chuck below displays the final curated basket genes.
tb <- DUX4_baskets %>%
  dplyr::select(-ens88_id, -gencode35_id, -gene_name.ens88 ) %>%
  dplyr::rename(gene_name = gene_name.gencode35) %>%
  dplyr::mutate(gene_name = kableExtra::cell_spec(gene_name,
                            color = if_else(`DUX4-M12`, "blue", "green")))

knitr::kable(tb, format="html", escape = F,
             caption="Proposed DUX4 basket genes that best represent DUX4 signature in FSHD muscle and with best performance in distinguish mildly to moderately affected muscles (Mild_Moderate) from the controls. The order is arranged by the combined ranks of pAUC and DESeq's adjusted p-value (Mild+Moderate vs. Controls). Color blue marks the genes selected for DUX4-M12. Columns avgTPM_M and avgTPM_H are the average TPM in the Mild+Moderate and IG-High+High groups in the longitudinal cohort; avgTPM_bilat is the average TPM in the bilate cohort. Columns DUX4-M, DUX4-M12, DUX4-M6, DUX4-H4 indicate (TRUE) the selected genes in the basket.") %>%
  kableExtra::kable_styling(font_size = 12) %>%
  kable_paper() %>%
  column_spec(11:14, background = "yellow") %>%
  column_spec(9, color = "white",
              background = spec_color(DUX4_baskets$avgTPM_M, end = 0.7)) %>%
  column_spec(10, color = "white",
              background = spec_color(DUX4_baskets$avgTPM_H, end = 0.7)) %>%
scroll_box(width = "800px", height="100%")| ens_id | gene_name | log2FoldChange | padj | pAUC | rank_pAUC | rank_deseq | combined_rank | avgTPM_M | avgTPM_H | avgTPM_Bilat | DUX4-M | DUX4-M12 | DUX4-M6 | DUX4-H4 |
|---|---|---|---|---|---|---|---|---|---|---|---|---|---|---|
| ENSG00000243073 | PRAMEF4 | 6.494382 | 0.0000015 | 0.1301282 | 7 | 1 | 4.0 | 0.5352541 | 9.259986 | 0.2361270 | TRUE | TRUE | FALSE | FALSE |
| ENSG00000204501 | PRAMEF15 | 6.792799 | 0.0000016 | 0.1301282 | 8 | 2 | 5.0 | 0.4217388 | 7.164506 | 1.0037029 | TRUE | TRUE | FALSE | FALSE |
| ENSG00000239810 | PRAMEF11 | 6.505570 | 0.0000078 | 0.1352564 | 5 | 6 | 5.5 | 0.5488044 | 8.983683 | 0.3803017 | TRUE | FALSE | FALSE | FALSE |
| ENSG00000180532 | ZSCAN4 | 4.180322 | 0.0000182 | 0.1467949 | 1 | 10 | 5.5 | 0.2158303 | 3.086214 | 0.6862935 | TRUE | TRUE | TRUE | FALSE |
| ENSG00000133101 | CCNA1 | 4.959525 | 0.0000176 | 0.1391026 | 3 | 9 | 6.0 | 0.7275092 | 8.855388 | 1.8482807 | TRUE | TRUE | TRUE | FALSE |
| ENSG00000232423 | PRAMEF6 | 6.329412 | 0.0000127 | 0.1282051 | 9 | 7 | 8.0 | 0.5107218 | 8.649240 | 0.2600617 | TRUE | FALSE | FALSE | FALSE |
| ENSG00000270601 | PRAMEF5 | 6.934306 | 0.0000030 | 0.1214744 | 14 | 3 | 8.5 | 0.7688555 | 12.984086 | 0.3194151 | TRUE | TRUE | TRUE | FALSE |
| ENSG00000229571 | PRAMEF25 | 6.545949 | 0.0000050 | 0.1214744 | 15 | 4 | 9.5 | 0.4478397 | 8.621985 | 0.1695898 | TRUE | FALSE | FALSE | FALSE |
| ENSG00000204505 | PRAMEF9 | 6.523210 | 0.0000163 | 0.1217949 | 13 | 8 | 10.5 | 0.5488385 | 9.083270 | 0.1583244 | TRUE | FALSE | FALSE | FALSE |
| ENSG00000116721 | PRAMEF1 | 6.036322 | 0.0000918 | 0.1282051 | 10 | 12 | 11.0 | 0.2077566 | 2.951845 | 0.5567977 | TRUE | FALSE | FALSE | FALSE |
| ENSG00000256980 | KHDC1L | 5.695502 | 0.0001591 | 0.1282051 | 11 | 13 | 12.0 | 0.9477280 | 11.527128 | 1.2314356 | TRUE | TRUE | TRUE | TRUE |
| ENSG00000269466 | H3Y1 | 4.166089 | 0.0012064 | 0.1384615 | 4 | 23 | 13.5 | 0.4627481 | 5.909785 | 1.7078574 | TRUE | TRUE | TRUE | FALSE |
| ENSG00000168930 | TRIM49 | 5.144043 | 0.0002090 | 0.1214744 | 17 | 15 | 16.0 | 0.1293434 | 2.510083 | 0.0716836 | TRUE | TRUE | FALSE | FALSE |
| ENSG00000230522 | MBD3L2 | 5.797543 | 0.0002924 | 0.1198718 | 19 | 17 | 18.0 | 0.3909339 | 9.114793 | 2.2537530 | TRUE | TRUE | TRUE | FALSE |
| ENSG00000205718 | MBD3L4 | 5.511101 | 0.0006516 | 0.1198718 | 20 | 20 | 20.0 | 0.3391694 | 7.785100 | 0.3875430 | TRUE | FALSE | FALSE | FALSE |
| ENSG00000120952 | PRAMEF2 | 6.284549 | 0.0002280 | 0.1128205 | 25 | 16 | 20.5 | 0.5119288 | 6.067948 | 1.1308570 | TRUE | FALSE | FALSE | TRUE |
| ENSG00000182315 | MBD3L3 | 5.581900 | 0.0005471 | 0.1163462 | 22 | 19 | 20.5 | 0.3574386 | 8.508810 | 0.1231469 | TRUE | TRUE | FALSE | FALSE |
| ENSG00000237247 | MBD3L5 | 5.409749 | 0.0007539 | 0.1198718 | 21 | 22 | 21.5 | 0.2994420 | 7.013449 | 0.3597400 | TRUE | FALSE | FALSE | FALSE |
| ENSG00000257951 | AC126177.5 | 5.509138 | 0.0004833 | 0.1128205 | 26 | 18 | 22.0 | 0.5153967 | 6.193099 | 1.6690444 | TRUE | FALSE | FALSE | FALSE |
| ENSG00000116726 | PRAMEF12 | 5.079211 | 0.0006678 | 0.1153846 | 23 | 21 | 22.0 | 0.2099574 | 4.031307 | 0.5945060 | TRUE | FALSE | FALSE | FALSE |
| ENSG00000275774 | HNRNPCL2 | 4.765133 | 0.0014362 | 0.1153846 | 24 | 24 | 24.0 | 0.2613301 | 3.639895 | 0.0814881 | TRUE | TRUE | FALSE | FALSE |
| ENSG00000144015 | TRIM43 | 4.928471 | 0.0023238 | 0.1086538 | 29 | 27 | 28.0 | 0.4129608 | 8.777963 | 1.4489644 | TRUE | TRUE | FALSE | TRUE |
| ENSG00000204481 | PRAMEF14 | 4.679139 | 0.0032861 | 0.1128205 | 28 | 29 | 28.5 | 0.1532112 | 2.212486 | 0.2039004 | TRUE | FALSE | FALSE | FALSE |
| ENSG00000179172 | HNRNPCL1 | 5.211942 | 0.0020996 | 0.0993590 | 32 | 26 | 29.0 | 0.1762821 | 2.060932 | 0.5642183 | TRUE | FALSE | FALSE | FALSE |
| ENSG00000251258 | RFPL4B | 4.458311 | 0.0024688 | 0.0990385 | 34 | 28 | 31.0 | 0.1581337 | 2.708745 | 0.3557771 | TRUE | FALSE | FALSE | FALSE |
| ENSG00000213921 | LEUTX | 4.296800 | 0.0187734 | 0.0942308 | 37 | 36 | 36.5 | 0.3775310 | 7.594258 | 0.7302045 | TRUE | FALSE | FALSE | TRUE |
| ENSG00000251360 | KHDC1P1 | 3.537317 | 0.0206139 | 0.0961538 | 36 | 37 | 36.5 | 0.2999165 | 3.347993 | 0.5497505 | TRUE | FALSE | FALSE | FALSE |
| ENSG00000204510 | PRAMEF7 | 4.989185 | 0.0166494 | 0.0923077 | 39 | 35 | 37.0 | 0.1372876 | 3.104424 | 0.5907762 | TRUE | FALSE | FALSE | FALSE |
| ENSG00000166013 | TRIM53BP | 3.606433 | 0.0300239 | 0.0929487 | 38 | 38 | 38.0 | 0.1011627 | 2.207272 | 0.3027689 | TRUE | FALSE | FALSE | FALSE |
| M6 | M12 | M | H4 |
|---|---|---|---|
| 0.5856008 | 0.4693059 | 0.3853466 | 0.5625372 |
B.5.2 Visualize TPM of basket-M12 genes
Boxplot of DUX4-M12 aasket genes
basketM12 <- DUX4_baskets %>% dplyr::filter(`DUX4-M12`)
col_data <- as.data.frame(colData(longitudinal_dds))
data <- as.data.frame(assays(longitudinal_dds)[["TPM"]][basketM12$ens88_id, ]) %>%
  rownames_to_column(var="ens88_id") %>%
  dplyr::left_join(anno_ens88, by="ens88_id") %>% # add gene_name
  tidyr::gather(key=sample_name, value=TPM, -ens88_id, -gene_name) %>%
  dplyr::left_join(col_data %>% dplyr::select(sample_name, cluster),
                   by="sample_name") %>%
  dplyr::mutate(gene_name = factor(gene_name))

data %>% dplyr::filter(cluster%in% c("Control", "Mild", "Moderate")) %>%
  dplyr::mutate(`log10TPM` = log10(as.numeric(TPM)+1)) %>%
  ggplot(aes(x=cluster, y=log10TPM)) +
    geom_boxplot(width=0.7, outlier.shape=NA) +
    geom_jitter(width = 0.3, size=0.5, color="steelblue", alpha=0.5) +
    facet_wrap(~gene_name, scale="free_y") +
    theme_bw() +
    labs(y="log10(TPM+1)") +
    theme(axis.text.x = element_text(angle = 90, vjust = 0.5, hjust=1))
Figure B.3: Basket-M12: 12 top genes (out of the original 67) in discriminating between the mild+moderate and control groups.
Distribution of per sample average TPM of basket genes
basket_names <- c("DUX4-M6", "DUX4-M12", "DUX4-M", "DUX4-H4")
df <- map_df(basket_names, function(basket) {
  # tmp: convert ensembl v88 to gencode v36
  basket_genes <- DUX4_baskets %>% dplyr::filter(get(basket))
  as.data.frame(assays(longitudinal_dds)[["TPM"]][basket_genes$ens88_id, ]) %>%
      summarise(across(where(is.numeric), mean))
}) %>% t(.) %>% as.data.frame() %>%
  `colnames<-` (basket_names) %>%
  rownames_to_column(var="sample_name") %>%
  dplyr::left_join(col_data %>% dplyr::select(sample_name, cluster),
                   by="sample_name") %>%
  dplyr::filter(!cluster %in% c("Muscle-Low", "IG-High", "High")) %>%
  tidyr::gather(key=basket, value=avg_TPM, -sample_name, -cluster)


ggplot(df, aes(y=avg_TPM, x=cluster, color=cluster)) +
  geom_boxplot() +
  theme_minimal() +
  facet_wrap( ~ basket, scales="free")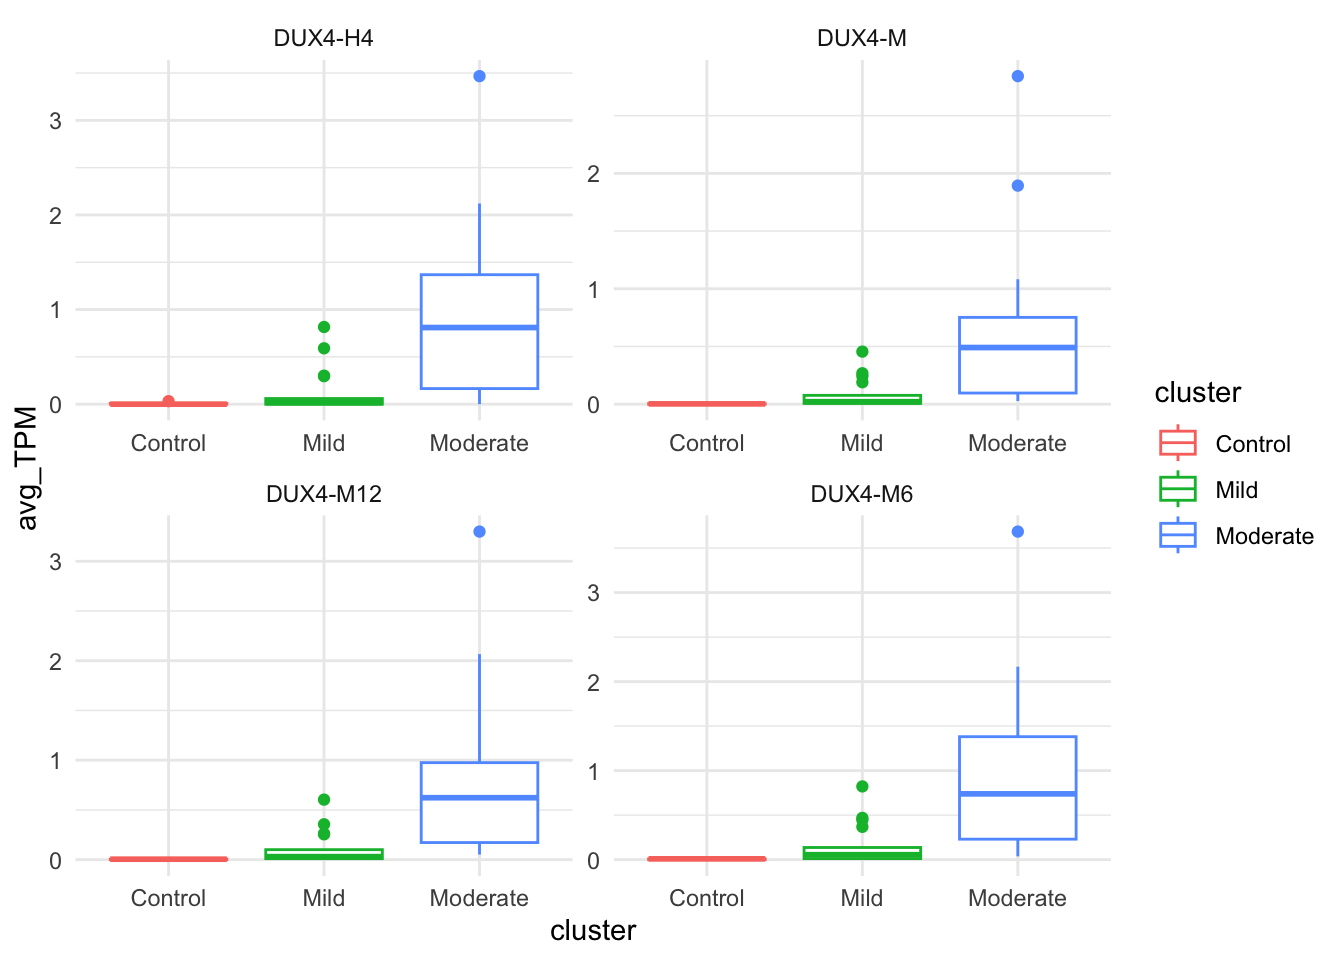
Figure B.4: Per-sample average TPM of DUX4-M6, DUX4-M12, DUX4-M, and DUX4-H4 genes.
B.6 Baskets performance - random forest and KNN
In this section, we used supervised machine learning algorithms to evaluate the performance of each of the baskets in discriminating between the controls and FSHD samples. We used the caret package that provides the interface to most of the machine learning models that existed in the R repository. There are many good choices for fitting the models, and we chose random forest and KNN and used leave-one-out cross-validation to estimate the classification accuracy.
B.6.1 Model characteristics
- Models: random forest and KNN
- Cross-validation: Leave-One-Out
- Value:
log10(TPM+1) - Reproducibility:
set.seed=123- control randomness - Training samples: we built two models here - one with all samples (except Muscle-less) and one with samples labelled Control, Mild and Moderate classes. That is, the two discrimination models are Control vs. FSHD and Control vs. Mild+Moderate.
- Participated baskets: DUX4-H4, DUX4-M6, DUX4-M12, and DUX4-M
- Accuracy: Table B.4)
Code below extracts predictors matrix:
suppressPackageStartupMessages(library(caret))
set.seed(123)
load(file.path(pkg_dir, "data", "DUX4_baskets.rda"))
# set up the predictor's data matrix (log10(TPM+1))
.predictor_df <- function(predictor, class) {
  sub <- dds[predictor, dds$cluster %in% class]
  data <- log10(assays(sub)[["TPM"]] +1) %>% t(.) %>%
    as.data.frame() %>%
    add_column(pheno_type = sub$pheno_type) %>%
    rename_with(~ str_replace(.x, "\\..*", ""), starts_with("ENSG"))
}

# log10TPM predictor matrix: for moderate and all samples for testing

# Model 1: control vs. Mild+Moderate
class <- c("Control", "Mild", "Moderate")
moderate_smp <- list(
  M6 = .predictor_df(DUX4_baskets %>% dplyr::filter(`DUX4-M6`) %>% pull(ens88_id),
                     class = class),
  M12 = .predictor_df(DUX4_baskets %>% dplyr::filter(`DUX4-M12`) %>% pull(ens88_id),
                      class = class),
  M = .predictor_df(DUX4_baskets %>% dplyr::filter(`DUX4-M`) %>% pull(ens88_id),
                    class = class),
  H4 = .predictor_df(DUX4_baskets %>% dplyr::filter(`DUX4-H4`) %>% pull(ens88_id),
                     class = class))

class <- c("Control", "Moderate", "IG-High", "High")
MH_smp <- list(
  M6 = .predictor_df(DUX4_baskets %>% dplyr::filter(`DUX4-M6`) %>% pull(ens88_id),
                     class = class),
  M12 = .predictor_df(DUX4_baskets %>% dplyr::filter(`DUX4-M12`) %>% pull(ens88_id),
                      class = class),
  M = .predictor_df(DUX4_baskets %>% dplyr::filter(`DUX4-M`) %>% pull(ens88_id),
                    class = class),
  H4 = .predictor_df(DUX4_baskets %>% dplyr::filter(`DUX4-H4`) %>% pull(ens88_id),
                     class = class))

# Model 2: control vs. IG-High and High
class <- c("Control", "IG-High", "High")
high_smp <- list(
  M6 = .predictor_df(DUX4_baskets %>% dplyr::filter(`DUX4-M6`) %>% pull(ens88_id),
                     class = class),
  M12 = .predictor_df(DUX4_baskets %>% dplyr::filter(`DUX4-M12`) %>% pull(ens88_id),
                      class = class),
  M = .predictor_df(DUX4_baskets %>% dplyr::filter(`DUX4-M`) %>% pull(ens88_id),
                    class = class),
  H4 = .predictor_df(DUX4_baskets %>% dplyr::filter(`DUX4-H4`) %>% pull(ens88_id),
                     class = class))

# model 3: Control vs. all FSHDs
class <- c("Control", "Mild", "Moderate", "IG-High", "High")
all_smp <- list(
  M6 = .predictor_df(DUX4_baskets %>% dplyr::filter(`DUX4-M6`) %>% pull(ens88_id),
                     class = class),
  M12 = .predictor_df(DUX4_baskets %>% dplyr::filter(`DUX4-M12`) %>% pull(ens88_id),
                      class = class),
  M = .predictor_df(DUX4_baskets %>% dplyr::filter(`DUX4-M`) %>% pull(ens88_id),
                    class = class),
  H4 = .predictor_df(DUX4_baskets %>% dplyr::filter(`DUX4-H4`) %>% pull(ens88_id),
                     class = class))
B.6.2 Models and leave-one-out cross-validation
.rf_knn_fit <- function(matrix_lists) {
  # lapply H4, M6, M12, and M
  fit <- lapply(matrix_lists, function(df) {
    # parameter tunning
    fit_ctrl <- trainControl(method = "LOOCV",
                             number = 10,
                             #repeats = 10,
                             classProbs = TRUE)
                             #summaryFunction = twoClassSummary)
    # model - rf
    rf_fit <- train(pheno_type ~ .,
                    data = df,
                    method = "rf",
                    tuneLength = 35,
                    preProcess = "pca",
                    trControl = fit_ctrl,
                    metric = "Accuracy",
                    na.action = "na.omit")
    # knn
    knn_fit <- train(pheno_type ~ .,
                    data = df,
                    method = "knn",
                    trControl = fit_ctrl,
                    metric = "Accuracy",
                    na.action = "na.omit")

    list(knn=knn_fit, rf=rf_fit) # return list
  })

  names(fit) <- names(fit)
  return(fit)
}

# model fitting
moderate_fit<- .rf_knn_fit(moderate_smp)
high_fit <- .rf_knn_fit(high_smp)
all_fit <- .rf_knn_fit(all_smp)
MH_fit <- .rf_knn_fit(MH_smp)
save(all_fit, file=file.path(pkg_dir, "data", "all_fit.rda"))
save(moderate_fit, file=file.path(pkg_dir, "data", "moderate_fit.rda"))
save(MH_fit, file=file.path(pkg_dir, "data", "MH_fit.rda"))
B.6.3 Accuracy
.tidy_fit_accuracy <- function(fit_lists, model) {
  tb <- map_df(fit_lists, function(fit) {
    c(rf = max(fit$rf$results[, "Accuracy"]),
      knn = max(fit$knn$results[, "Accuracy"]))
    }) %>%
    add_column(basket=paste0("DUX4-", names(fit_lists)), .before="rf") %>%
    add_column(model = model)
}

moderate_fit_accuracy <- .tidy_fit_accuracy(moderate_fit,
                                            model="Control vs. Mild+Moderate")
high_fit_accuracy <- .tidy_fit_accuracy(high_fit,
                                        model="Control vs. IG-High+High")
all_fit_accuracy <- .tidy_fit_accuracy(all_fit,
                                        model="Control vs. Mild+Moderate+IG-High+High")
MH_fit_accuracy <- .tidy_fit_accuracy(MH_fit,
                                        model="Control vs. Moderate+IG-High+High")
# kable
bind_rows(all_fit_accuracy, moderate_fit_accuracy, ) %>%
  bind_rows(MH_fit_accuracy) %>%
  bind_rows(high_fit_accuracy) %>%
  knitr::kable(format="html", escape = F,
               caption="Random Forest and KNN model Accuracy estimated by leave-one-out cross-validation.") %>%
  kableExtra::kable_styling(font_size = 12) %>%
  kable_paper() %>%
  row_spec(1:4, bold = T, color = "white", background = "steelblue") %>%
  row_spec(5:8, bold = T, color = "white", background = "chocolate") %>%
row_spec(9:12, bold = T, background = "gray75") | basket | rf | knn | model |
|---|---|---|---|
| DUX4-M6 | 0.9206349 | 0.8888889 | Control vs. Mild+Moderate+IG-High+High |
| DUX4-M12 | 0.9047619 | 0.9206349 | Control vs. Mild+Moderate+IG-High+High |
| DUX4-M | 0.9206349 | 0.9047619 | Control vs. Mild+Moderate+IG-High+High |
| DUX4-H4 | 0.7936508 | 0.8095238 | Control vs. Mild+Moderate+IG-High+High |
| DUX4-M6 | 0.8723404 | 0.8510638 | Control vs. Mild+Moderate |
| DUX4-M12 | 0.9148936 | 0.8936170 | Control vs. Mild+Moderate |
| DUX4-M | 0.8723404 | 0.8723404 | Control vs. Mild+Moderate |
| DUX4-H4 | 0.7446809 | 0.7659574 | Control vs. Mild+Moderate |
| DUX4-M6 | 1.0000000 | 0.9565217 | Control vs. Moderate+IG-High+High |
| DUX4-M12 | 1.0000000 | 0.9347826 | Control vs. Moderate+IG-High+High |
| DUX4-M | 1.0000000 | 0.9347826 | Control vs. Moderate+IG-High+High |
| DUX4-H4 | 0.9130435 | 0.9347826 | Control vs. Moderate+IG-High+High |
| DUX4-M6 | 1.0000000 | 1.0000000 | Control vs. IG-High+High |
| DUX4-M12 | 1.0000000 | 1.0000000 | Control vs. IG-High+High |
| DUX4-M | 1.0000000 | 1.0000000 | Control vs. IG-High+High |
| DUX4-H4 | 1.0000000 | 0.9583333 | Control vs. IG-High+High |
B.6.4 Conclusion
In the comparison betweenControl and Moderate+IG-High+High groups, all baskets achieve similar levels of accuracy. However, when comparing Control with Mild+Moderate groups, the random forest model shows that basket DUX4-M6 outperforms DUX4-H4. This indicates that the DUX4-M6 basket is more effective at identifying DUX4-targeted muscles when there are moderate levels of RNA expression.